









Senior Practitioner · Social Impact · Bay Area

Senior practitioner of corporate social impact, ESG, and community investment.

This site is for recruiters and hiring managers considering me for senior roles. Fifteen years of work across Salesforce, PlayStation, Splunk, and Proofpoint. I'd rather you see the actual work, plainly, than make the case from a resume.

Aaron Chrisco

What I've Built Across

Ten capabilities. Every function.
15 years.

Each one is a real operating discipline I've owned, not a topic. Built with Legal, Finance, Comms, Marketing, Product, HR, and Security. Click any capability on the right to see its full cross-functional build.

20 case studies. Salesforce to Proofpoint.

Every program above traces back to a real engagement, with its own operating model, partner ecosystem, and documented outcome. Read the receipts.

Open the case studies
Salesforce Twilio Sephora Box Splunk PlayStation Proofpoint Salesforce Twilio Sephora Box Splunk PlayStation Proofpoint

Structured for outcomes.
Built for durability.

I build social impact programs the way you'd build a product, with clear objectives, structured execution, honest measurement, and long-term durability.

Business-first design

Start with the business case, not the press release. Ground every program in real organizational context.

Measurement built in

Design for honest evaluation from day one. If you can't define failure, you're not measuring impact.

Durable partnerships

Build partnerships that survive leadership transitions, structured for institutional value, not just optics.

Operational discipline

Build the governance, cadence, and infrastructure that makes impact work sustainable at scale.

Explore Patricia.ai

One Platform. Ten solutions. Click any tab to see what each does.

An interactive walkthrough of the platform. Click a vertical on the laptop sidebar or in the tab row below to see how each one works in practice.

Patricia dashboard preview

Blog

Working positions, after 15 years.

Working positions on social impact, ESG measurement, partnerships, workforce strategy, and the operating systems that make this work hold up.

For Recruiters & Hiring Managers

Save 30 minutes of back-and-forth.

A structured pre-screen built for recruiters and hiring managers. Direct answers about fit, scope, and posture so you can spend the call deciding instead of clarifying.

Open the resource
Two people in a hiring conversation

Case Studies

What I've built.

Selected work from across four major technology companies. Each entry represents a program or system I designed, built, or led, not a job description. Click any card for the full case study.

Hiring for a role? Match a JD to this work.
Paste a job description and JD Match will rank these case studies by fit.
Open JD Match
Showing all 20 case studies. Tap a capability pill on the left to filter. Showing cases with: , · ,

2011 – 2014

Built the partnerships, open-source product, and operating systems that turned 1-1-1 from a license-donation pledge into a real platform for the social sector.

4
Use cases
$26.7M+
Anchor investment
Global
Scope

2017 – 2021

Built Splunk for Good as one integrated platform: humanitarian data, the nonprofit ecosystem, engagement systems, and a cybersecurity workforce pipeline.

5
Use cases
2,000+
Partner ecosystem
Global
Scope

Five Programs, One Platform: Splunk's Corporate Impact Operating Model

Creating an integrated impact platform across product, philanthropy, partnerships, and workforce.
ESGPartnershipsNonprofit GTMEmployee Giving & VolunteeringCareer PathwaysData-for-Good

Scaling Splunk Across the Nonprofit and Public Sectors Worldwide

Designed and scaled Splunk's nonprofit & public sector ecosystem, product, partners, workforce, and compliance integrated into one adoption system.
110+countries · 3,900+ nonprofits/yr · 2,000+ partners
Nonprofit GTMPartnershipsCareer Pathways

Using a Data Platform for Crisis Response and Humanitarian Operations

Turned Splunk into a real-time intelligence layer across humanitarian response, anti-trafficking, and wildfire evacuation, data infrastructure applied to high-stakes, real-world problems.
40,000+displaced served weekly · millions of records · minutes vs. hours
Data-for-GoodCrisis ResponsePartnerships

Splunk's Global Employee Volunteering Platform Across 20+ Countries

Led design and global scaling of Splunk's engagement system, Benevity infrastructure, standardized VTO, flagship programs, and recognition, across 30+ offices and 20+ countries.
62%first-campaign participation · 45% YoY volunteer growth · 20+ countries
Employee Giving & Volunteering

Training Veterans and Underserved Youth for Cybersecurity Careers

Market-aligned talent pipeline built on Splunk's platform and certifications, veterans and young adults from underserved communities into cybersecurity, IT, and data roles via NPower, Year Up, and WWP.
15,000+Splunk-using orgs creating hiring demand · thousands trained
Career PathwaysPartnershipsDE&I / BelongingNonprofit GTM

2021 – 2024

Built and led PlayStation's global social impact function across product, partnerships, workforce, and Sony ESG integration.

4
Use cases
Global
Function
Global
Scope

Building a Social Impact Function Inside a Major Gaming Company

Built and helped scale PlayStation's global function across Americas, EMEA, and APAC, partnerships, workforce pipeline, employee engagement, and studio integration as one operating system.
$6M+annual giving · 32 countries · $17M+ Social Justice Fund
ESGPartnershipsEmployee Giving & VolunteeringCareer PathwaysBrand & IP

Translating Sony's Corporate ESG Commitments Into PlayStation Operations

Translated Sony's Road to Zero and SBTi-approved targets into PlayStation execution, product lifecycle, supply chain, player-facing engagement (Playing for the Planet, Aloy's Forest), and the $100M Global Social Justice Fund.
2040 net-zero100% renewable by 2030 · CDP A-List · $100M Social Justice Fund
ESGSustainabilityPartnershipsBrand & IP

PlayStation Career Pathways: A Multi-Year Talent Pipeline for Game-Industry Careers

Created a multi-year pre-internship pipeline built around scholarships, sponsorship-grade mentorship, industry exposure, and a peer cohort community (UNCF, Jackie Robinson Foundation, BCGA, USC Games, Gameheads).
$17M+SIE Social Justice Fund commitments · 5 partner channels · 26-scholar inaugural cohort
Career PathwaysPartnershipsDE&I / Belonging

Building Social Impact Directly Into PlayStation Games

Embedded social impact directly into gameplay, content, and studio ecosystems, Horizon FW × Arbor Day Foundation, MLB The Show × Jackie Robinson Foundation, Spider-Man 2 × Gameheads, God of War Ragnarök × Black Girls CODE.
600K+trees · $1M Gameheads · $875K+ JRF · $100K+ Black Girls CODE
Brand & IPPartnershipsSustainabilityDE&I / BelongingCareer Pathways

2025 – 2026
Built Proofpoint's ESG operating system as enterprise infrastructure: governance, global giving, sustainability operations, and post-DEI belonging work.

4
Use cases
Enterprise
Scale
Global
Scope

2016 – 2017

Designed Twilio.org's global volunteering and giving system on a hub-and-spoke model: central strategy, local execution.

1
Use case
Global
Scope
Engagement
Focus

2015 – 2016

Co-built ImpactCloud at Box.org: a multi-vendor cloud coalition (Box, Salesforce, Okta, Splunk, Tableau, Twilio, DocuSign) bringing integrated infrastructure to the humanitarian sector.

1
Use case
Cloud
Infrastructure
Global
Scope

2015

Designed Sephora's hybrid philanthropic architecture: a DAF for capital protection, Sephora Stands for operating flexibility, with a path to a foundation at scale.

1
Use case
Hybrid
Giving model
Global
Scope
Case Studies Salesforce Case Study

Building a Citywide STEM and Workforce Pipeline Through Public-Private Partnership

A decade-long partnership with the San Francisco Mayor's Office and SFUSD that turned a one-time corporate gift into a durable model for public-school computer science access, and a national reference point for what real public-private partnership can look like.

Partnerships Career Pathways
Salesforce · SFUSD · SF Mayor's Office
$26.7M+
Total Salesforce investment in SFUSD over the partnership
20+
Middle schools touched by the Principal Innovation Fund & Salesforce-supported programs
10+ yrs
Continuously renewed across three mayors and multiple superintendents
Partners
Salesforce, SFUSD, SF Mayor's Office
My Role
Strategy, partnership design, and operating governance
Years
2013 – Present (decade-long)
Scale
Citywide, every SFUSD middle school

An ambitious city, an under-resourced district, and a tech sector with no real plan for either.

San Francisco was at the center of the global tech economy. The companies headquartered here were generating extraordinary wealth, and the public schools educating the city's next generation were, by every measure, falling further behind. Computer science access was uneven. Schools serving the most under-resourced communities had the least. And the dominant model for "tech giving back" was a patchwork of one-off donations, branded events, and volunteer days, visible, but not durable.

When Salesforce and the San Francisco Mayor's Office decided to do something different with SFUSD, the question wasn't whether to give. It was how to design a partnership that would actually move the system.

Most corporate-school partnerships break in the same four places.

  • The funding doesn't reach the classroom. Money moves through a foundation, gets reallocated, and ends up funding administration instead of students.
  • The programs don't survive leadership transitions. A new superintendent, a new principal, a new VP, and the work disappears.
  • Schools are treated as recipients, not designers. The corporation defines the program; the schools execute it. It rarely fits the building it lands in.
  • Outcomes don't get measured honestly. Press releases substitute for evaluation. The next renewal gets funded on goodwill, not evidence.
The brief was straightforward: design something that wouldn't break in any of those four places.

Strategy, structure, and the operating model behind the partnership.

I helped design the partnership architecture and the governance that made it run, translating a high-visibility political and corporate commitment into something that worked at the level of actual schools, principals, and classrooms.

  • Designed the program model with SFUSD and Mayor's Office leadership, including how funding flowed, who decided what, and how schools opted in.
  • Built the principal-led innovation model that put decision authority inside the buildings doing the work.
  • Established the operating cadence between Salesforce, the district, and City Hall, quarterly governance, annual renewal, public reporting.
  • Connected the partnership to Salesforce's broader workforce engagement, making it real for employees, not just executives.

Four layers, designed to reinforce each other.

Each layer was load-bearing. Pulling one out would have collapsed the others, which is the test of whether the design is integrated or just stapled together.

LAYER 01

Targeted investment + infrastructure

  • Direct funding to every SFUSD middle school, sized to make CS access real, not symbolic.
  • Investment in technology, devices, and curriculum infrastructure, the unglamorous foundation other programs rely on.
  • Multi-year commitment so schools could plan beyond a single budget cycle.
LAYER 02

Principal-led innovation

  • The Principal Innovation Fund put real budget authority in principals' hands, not a centralized program office.
  • Schools designed what worked for their students; the partnership funded execution.
  • Built in accountability: principals reported on what they tried, what worked, and what didn't.
LAYER 03

Teacher support & capacity building

  • Sustained investment in the teachers asked to deliver CS, not a one-time training day.
  • Curriculum support and coaching so the model could survive teacher turnover.
  • Recognition that durable program quality lives or dies with the educator in the room.
LAYER 04

Workforce & volunteer engagement

  • Salesforce employees engaged as mentors, classroom volunteers, and pathway connectors, at scale, not one-off.
  • Made the partnership tangible to the workforce funding it through their own time and proximity.
  • Created the connective tissue between the company's people and the city's students.

The structural choices that kept it from breaking.

Design Decisions

  • Money flowed to schools, not through three layers of foundation overhead.
  • Decision authority sat with principals, who knew their students and their building.
  • Governance was built to outlast the people who launched it, three mayors, multiple superintendents, leadership turnover at Salesforce.
  • The corporation showed up as a long-term partner, not a sponsor, annual renewal, public reporting, real accountability.
  • The program got harder over time, not easier, every year added accountability, scope, and ambition.

How a one-year commitment became a decade-long institution.

Launch

Initial multi-year commitment to fund CS in SFUSD middle schools, anchored by the Mayor's Office.

Scale

Expanded to every SFUSD middle school. Principal Innovation Fund formalized.

Deepen

Added teacher capacity-building, curriculum support, and structured volunteer engagement at scale.

Institutionalize

Became a national reference model, sustained across leadership transitions in city, district, and company.

What the partnership produced.

$26.7M+
Direct investment in SFUSD
Across the life of the partnership
20+
Middle schools reached
Districtwide CS access, including schools historically left out
10+ yrs
Continuous renewal
Across three mayors and multiple superintendents
National
Reference model
Cited as a template for public-private K–12 partnerships

For the city. For the company. For the model itself.

For San Francisco

  • Computer science became real, not aspirational, for tens of thousands of students who would not otherwise have had access.
  • Principals had funding and authority to design what their students needed, not what a central office prescribed.
  • The city had a partnership it could point to as evidence that "tech and the public sector working together" wasn't a slogan.
  • The model sustained across political transitions, a rare proof point in city/corporate work.

For Salesforce

  • Anchored Salesforce's identity as a serious civic institution in its hometown, not just a donor.
  • Created a credible, durable platform for employee engagement at meaningful scale.
  • Built genuine relationships with city and district leadership that carried into other initiatives.
  • Set the operating standard for how the company approached every public-sector partnership that followed.

My Approach

I build social impact work that compounds.

Five methodologies I bring to making that happen. How I build the work. Where I place it. How I balance both sides. How I sequence it across years. And the six recurring shapes the work shows up in.

Click any methodology to read the full breakdown
01
How I build the work
Three moments. Three kinds of rigor.
Before I start. While I build. How I measure.
02
Where I place it
An operating function, not a campaign.
Real operating seat. Cross-functional integration.
03
How I balance both sides
Company stronger and community stronger.
Dual-benefit test. Run on every program.
04
How I sequence the work
Year one earns year two.
Three deliberate phases. Each earns the next.
05
Shapes the work takes
Six recurring patterns.
Decision matrix. Match moment to motion.
Methodology 01

How I build the work

Three moments. Three different kinds of rigor.

What I do before I start, while I build, and how I measure. The same 3-beat runs underneath every program I take on.

01

Before I start

I find out what the company actually does.

Not what it says in the keynote. Not what's on the brand site. What the company actually has the capability and credibility to do. Who actually decides the budget. What the real calendar is. Where the work plugs into something the business already cares about.

If I can't answer those four things on a single page, I'm not ready to start designing.

Strategic Anchor Map: annotated org-and-strategy diagram showing how a social impact program plugs into the company's actual business. Capability map, exec sponsor chain, budget cycle overlay
02

While I build

I write down the things nobody else writes down.

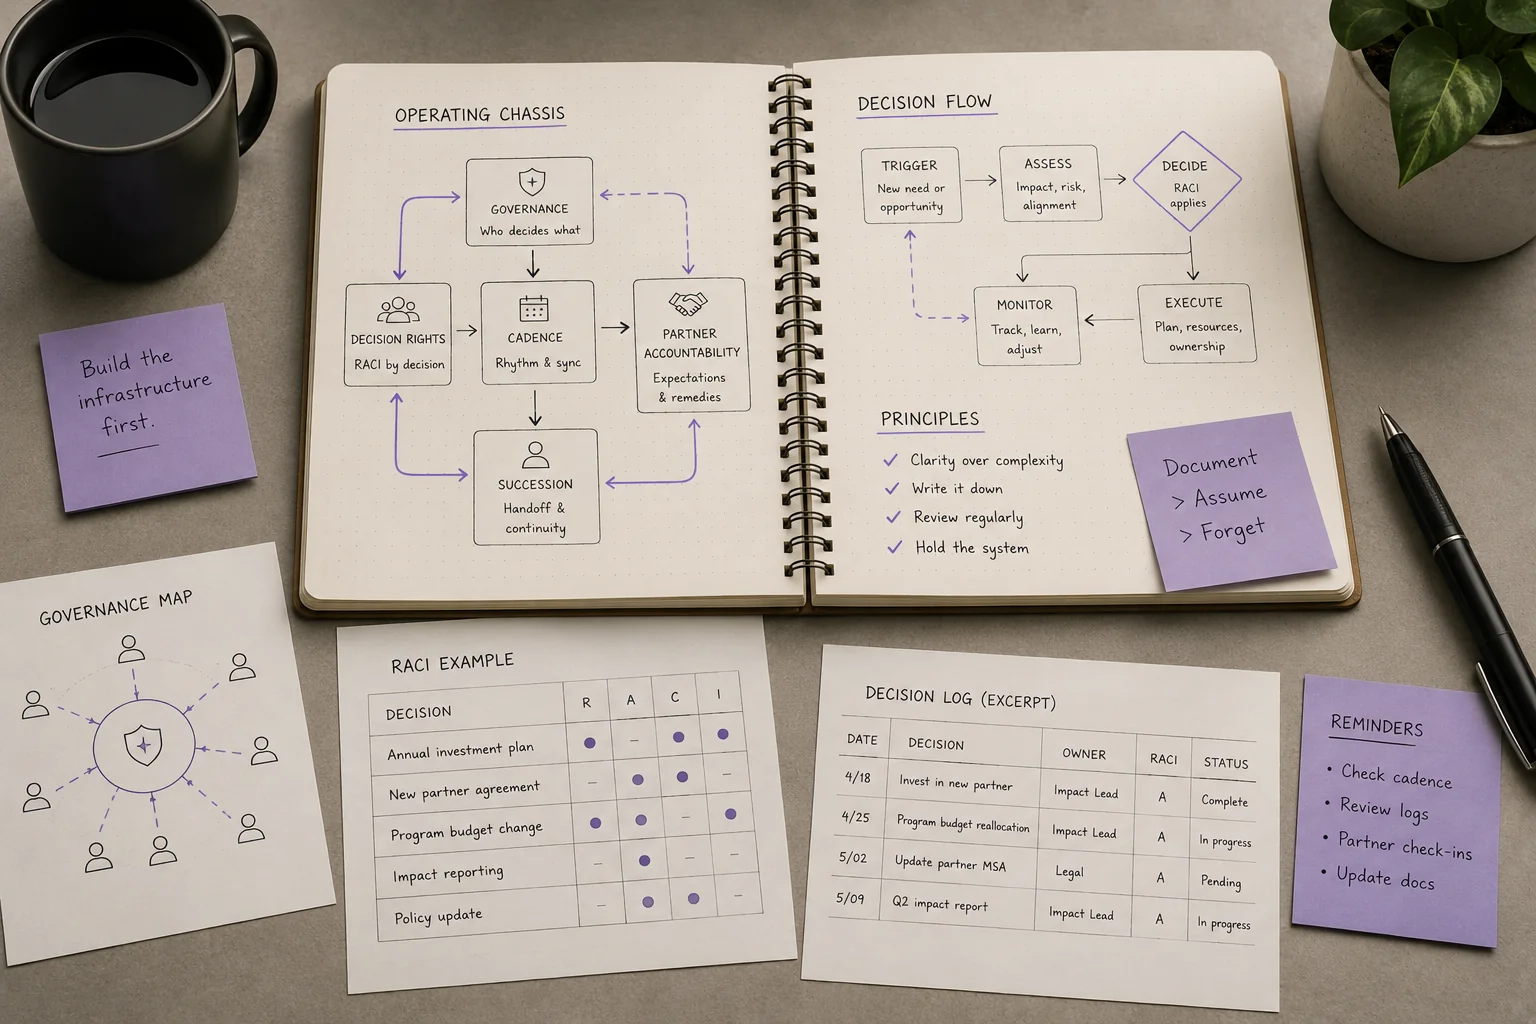
Most impact teams own the work. They don't own the system around it. So I write down five things, in order, before launch, and I treat them like infrastructure.

01Governance. Who decides what, in writing.
02Decision rights. A RACI for every recurring decision.
03Cadence. Weekly, monthly, quarterly, annually.
04Partner accountability. Trust written into the contract.
05Succession. A 30-day onboarding doc for the next operator.
Operating model: a notebook diagram showing the five artifacts (governance, decision rights, cadence, partner accountability, succession), plus a sample RACI table and decision log excerpt
03

How I measure

I write the numbers before launch.

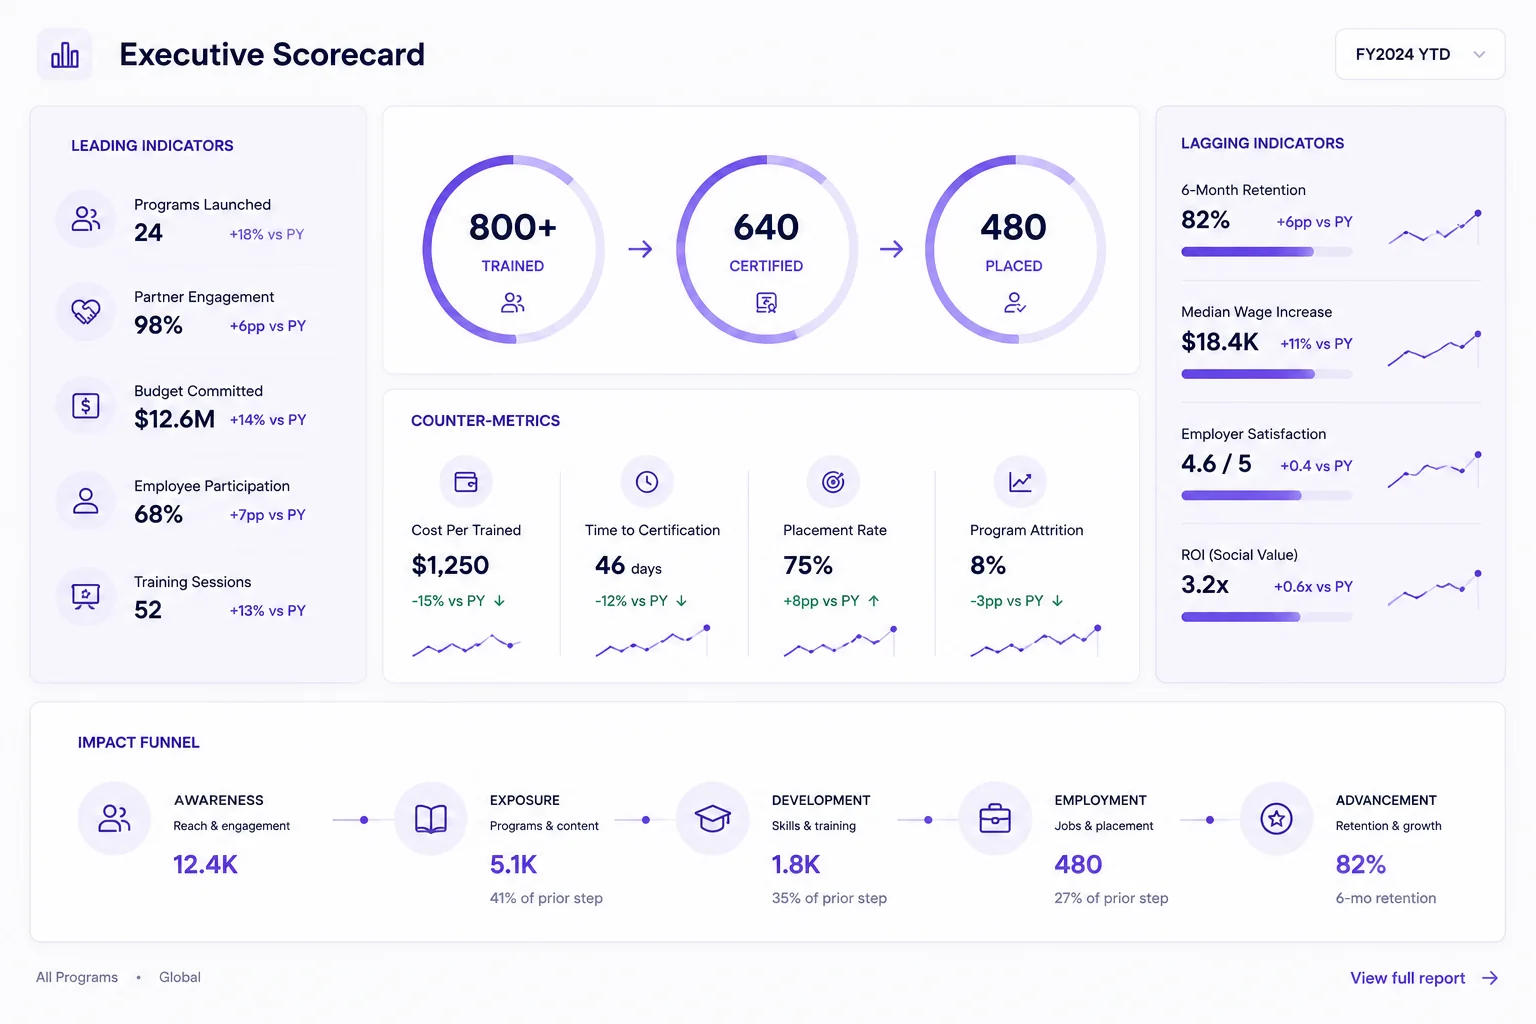
Real numbers, signed off by Finance, with counter-metrics that catch self-deception. The funnel from SplunkWork+ is what an honest scorecard looks like:

800+

Trained

640

Certified

480

Placed

If the next leader can't read the dashboard and run the function, I didn't finish the job.

Executive Scorecard: leading indicators, counter-metrics, lagging indicators, and the impact funnel from awareness through advancement
Methodology 02

Where I place it in the org

Social impact is an operating function, not a campaign, not a side project.

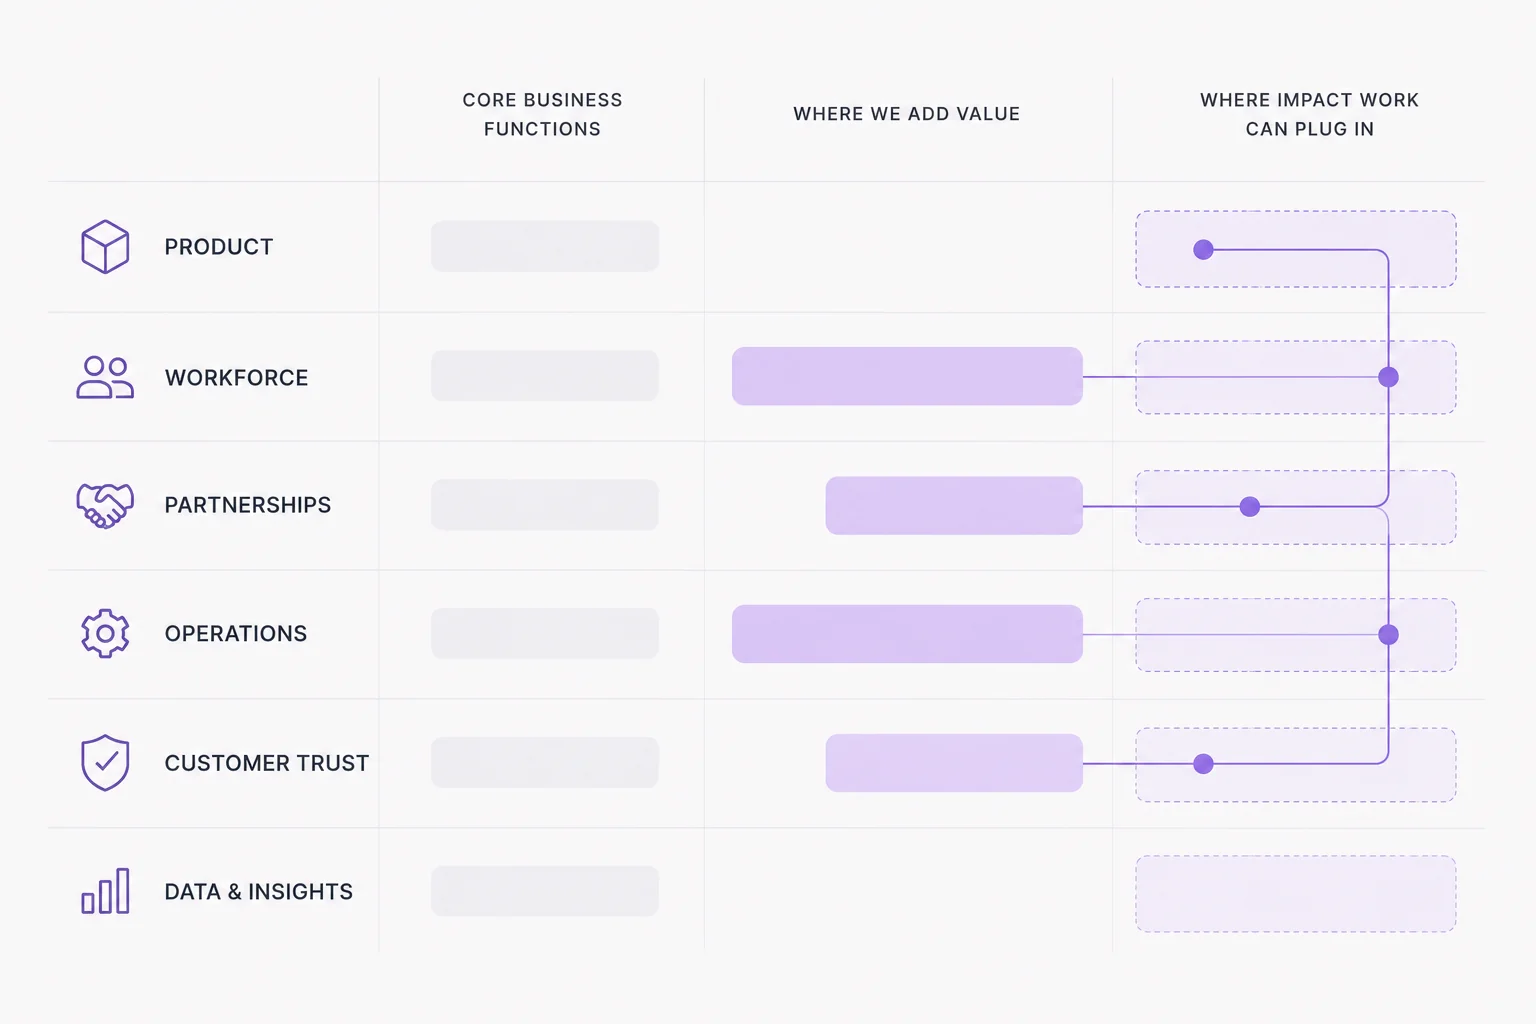
Where the work sits in the org determines what it's allowed to become. I argue for a real operating seat with structural integration into every part of the business it touches.

For most of the last decade, social impact has lived in Marketing as a campaign team, in HR as a side project, or in Communications as messaging around the foundation. None of those placements give the work the structural standing it needs to compound.

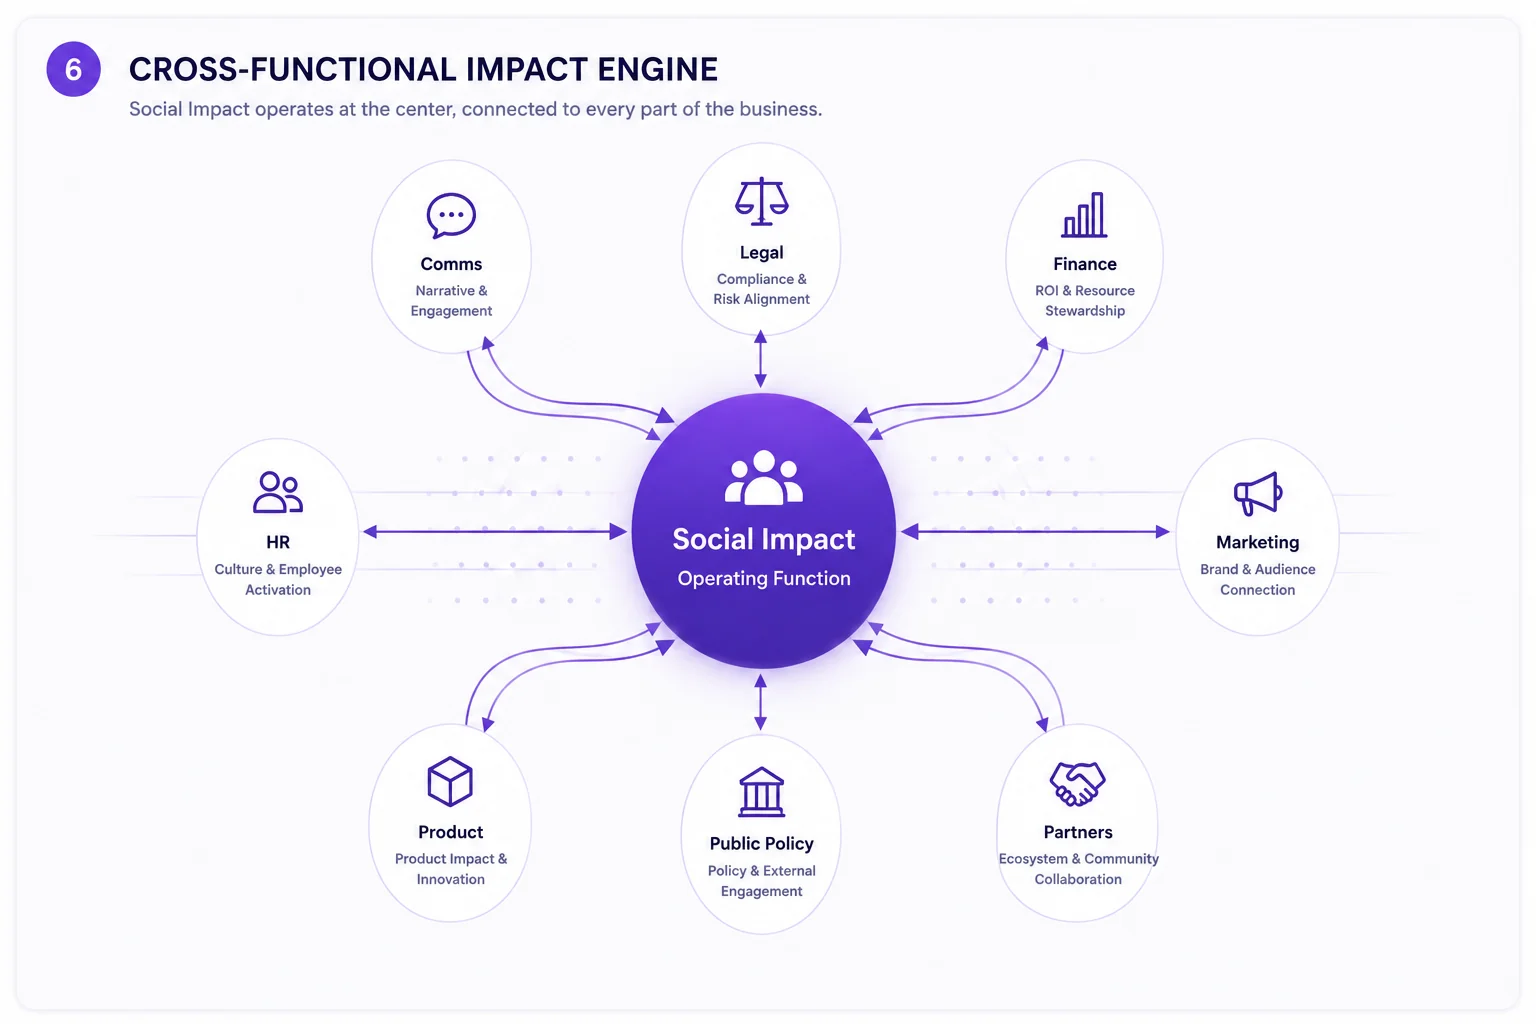
I argue for something different. Social impact runs best as an operating function, with its own seat, its own operating model, and structural integration into every cross-functional partner the work touches: Legal, Finance, Marketing, Product, HR, Communications.

Not centralized inside Marketing. Not orphaned in HR. Connected to all of them, owned by an operator who has the standing to convene them.

The test I run

"Who needs to be in the room every week for this work to be real?"

Cross-Functional Impact Engine: Social Impact as the operating function at the center, connected to Comms (Narrative & Engagement), Legal (Compliance & Risk Alignment), Finance (ROI & Resource Stewardship), Marketing (Brand & Audience Connection), Partners (Ecosystem & Community Collaboration), Public Policy (Policy & External Engagement), Product (Product Impact & Innovation), and HR (Culture & Employee Activation)
Methodology 03

How I balance both sides

The strongest work makes the company stronger and the community stronger, at the same time.

Pure business benefit isn't impact. Pure community feel-good isn't durable. I build for the kind of work where both sides win, and where the two sides reinforce each other over time.

When the work makes the company stronger and the community stronger, it has staying power. Employees show up for it. Sponsors fund it. Customers reward it. Partners stick with it. The two sides reinforce each other and the work compounds.

When only one side wins, the work eventually loses. Programs built for company benefit alone get cut the moment the business priority shifts. Programs built for community feel-good alone run out of internal energy. The dual-benefit test is the one I run on every vertical I build inside.

Company gain
Function
Community gain

Audit-ready disclosure, regulatory readiness, investor credibility, customer trust during procurement.

Governance & disclosure

ESG

Real accountability for environmental and social outcomes. Standards the public can verify.

Reduced operating cost, climate-risk mitigation, regulation readiness, brand differentiation.

Climate & environment

Sustainability

Real emissions reduction, cleaner supply chains, climate action that scales beyond a single company.

Capacity the company can't build alone. Public-sector trust. Networks and credibility that money can't buy.

Programs & capital

Strategic Partnerships & Investment

Multi-year capital, real institutional support, co-designed programs that fit community need.

Retention, engagement, cultural pride, stronger talent magnetism, lower attrition.

Programs & people

Employee Giving & Volunteering

Skilled human capital deployed to nonprofits. Sustained giving. Pro-bono expertise at scale.

Talent pipeline, industry-relevant skill development, future workforce, lower hiring cost.

Pipelines & talent

Education & Career Pathways

Real access to economic mobility. Skills training that leads to actual jobs. Pathways for underrepresented talent.

New revenue motion. Customer expansion. Sales enablement. Brand credibility in a fast-growing segment.

Product & revenue

Nonprofit GTM & Product Donation

Production-grade technology nonprofits actually use. Sector-specific support, not one-size-fits-all.

Earned narrative. Cultural relevance. IP differentiation. Storytelling people actually share.

Brand & comms

Brand Integration & Storytelling

Visibility for issues audiences wouldn't otherwise see. Cultural amplification of the underlying program.

Demonstrated speed and capability. Tech leadership positioning. Earned media. Employee pride.

Speed & assets

Data-for-Good & Crisis Response

Real-time platforms that aid first responders. Open-source assets that scale beyond any one crisis.

Talent retention. Diverse perspectives in product and strategy. Reduced legal exposure. Stronger market positioning.

Workforce & equity

DE&I & Belonging

Equity in workforce access. Supplier diversity reaching underrepresented businesses. Belonging as a structural reality.

When both sides win, the work compounds. When only one side wins, eventually the work loses. That's the test I run before I commit to any of the nine.

Methodology 04

How I sequence the work over time

Year one earns year two. Year two earns year three.

A program doesn't get strong by trying to do everything at once. It gets strong by doing one thing excellently, earning the right to do the next thing, and stacking credibility cycle by cycle.

Most teams try to launch big in year one. They run out of capacity, capital, or credibility before they reach year two. The teams whose work compounds start small, build the operating model, and let success in one cycle fund the next.

I sequence the work in three deliberate phases. Each one earns the next.

Phase 01

Year one

Establish credibility.

Pick the smallest version of the work that can be done excellently. Build the operating model around it. Earn one undeniable win that internal sponsors, external partners, and auditors can all point to.

What this earnsYear-one credibility opens year-two doors.

Phase 02

Year two

Expand the surface area.

With credibility in the bank, the same operating model can hold more programs, more partners, more visibility. Year-one wins make year-two budgets easier and year-two stakeholders more willing to lean in.

What this earnsScale without losing operational rigor.

Phase 03

Year three+

Institutionalize.

The function becomes part of how the company runs. It holds through leadership changes because the operating model is documented and the credibility is structural. The work is now infrastructure.

What this earnsA function the company carries forward.

The teams whose work compounds aren't the ones that ship the biggest year-one launch. They're the ones who treat year one as the foundation, not the finish line.

Methodology 05

The shapes the work takes

Six recurring patterns. Same rigor, different shape.

The work doesn't show up in one form. It comes in six recurring patterns depending on where the organization is. The methodology stays the same, the shape it takes changes.

Read this as a decision matrix. Match the moment the organization is in on the left to the kind of work that fits on the right.

When the org is...

starting from zero. No team, no operating model, nothing to build on.

The work looks like...

Stand up a function from scratch

Build the whole thing, strategy, governance, programs, partnerships, with the exec sponsorship to make it stick.

Anchor: Proofpoint's ESG operating system, 2025–2026.

When the org is...

running something stuck. The work exists but it's shallow, under-resourced, or losing steam.

The work looks like...

Mature an existing program

Take it from "exists" to durable. Real cadence, real governance, real KPIs, real partner depth.

Anchor: Salesforce 1-1-1 → Pledge 1%; PlayStation Cares FY22 → FY24 maturation.

When the org is...

deploying real capital at scale. Multi-region, multiple partners, real money on the table.

The work looks like...

Architect a portfolio

Tiered partner models, multi-region governance, joint operating programs at scale. Capital deployment with the audit trail to back it up.

Anchor: Sony Social Justice Fund, $100M+ across Americas, EMEA, APAC, 47-partner governance.

When the org is...

looking to own one vertical deeply. Function exists, but one specific vertical needs to be built end-to-end.

The work looks like...

Run one vertical, end-to-end

Take one of the nine and run it deep. Strategy, motion, partner ecosystem, proof, end to end.

Anchor: Splunk for Good. Nonprofit GTM motion from zero to 2,000+ NPO ecosystem.

When the org is...

between leaders. Prior operator is out, the work is in flux, the politics are tense.

The work looks like...

Inherit and steady the work

Inherit, stabilize, then evolve. Document what's there. Decide what stays. Build what's next. Hold steady through the political reset.

Anchor: Multiple companies, post-leadership transitions.

When the org is...

not ready to commit yet. You need to know what's broken before you commit to a fix.

The work looks like...

Audit & strategic recommendation

Assess what's there. Find the structural cracks. Recommend the right next move. Consulting-shaped engagement.

Anchor: Advisory engagements across enterprise SaaS and consumer technology.

Different shapes, same underlying methodology. The first four, build, place, balance, sequence, get applied to whichever shape the work needs to take.

What I’d build into your next impact function.

Impact tools haven’t kept up with the work. Patricia is what a modern one looks like, and what I’d build into your function.

Built for

Two software categories. Both built for someone else.

ESG software was built for sustainability and finance. Giving platforms were built for employees. Neither was built for the team running the function. Patricia sits in the gap.

Category 01 · ESG software

Watershed, Persefoni, Novata, Greenly, Workiva

Built forSustainability leads and CFOs.
SolvesCarbon footprint, Scope 1/2/3, CSRD, EcoVadis posture.
MissesCommunity investment, partnerships, decision rationale, impact-function lifecycle.
Category 02 · Giving platforms

Benevity, Bonterra, Submittable, Millie

Built forEmployees. Started as donation rails.
SolvesPayment infrastructure for matching gifts, dollars-for-doers, volunteer hours.
MissesEngagement layer with single-digit MAU at enterprises. Two products doing one job poorly.
Patricia.ai · the OS

For the team running the function.

Built forThe 3-to-15-person impact team. Admin layer only.
SolvesPartner lifecycle, decision rationale, audit posture, board narrative, leadership-transition continuity.
PricingPlatform tier + value under management. Not per-seat.

Employees aren’t users. They’re context the team manages. The team is the user, full stop.

The keystone insight
Operators

Six operators. One platform.

Patricia is built for the managers and specialists running each solution day-to-day, not the executive sponsoring the function. Pick the role and see what Patricia does for that work.

For the Giving & Volunteering Lead.

You run the giving programs and the volunteering work day-to-day. Matching gifts, employee giving, grant disbursements, VTO scheduling, skills-based matching, mentorship coordination. Today it lives across three spreadsheets and a Benevity dashboard.

  • One inventory of giving + volunteering data, not three spreadsheets and a vendor portal.
  • Matching gift programs with budget caps and payout tracking in one workflow.
  • Skills-based volunteering matching employee capability to nonprofit need.
  • Mentorship pipeline coordination with pairing, scheduling, outcome tracking.
  • Multi-year grant award tracking with grantee compliance.
Why now

The work is becoming auditable. Patricia is built for that turn.

Twenty years of being comms-adjacent. That era is ending. The disclosure pressure is the wedge.

HIGH LOW PRESSURE 2024 2026 2027 2030 EU CSRD CA SB 253 / 261 CSRD wave 2 + customer RFPs Table stakes
2024 · EU CSRD
The auditable era begins.

First wave of EU and US-listed multinationals report. Audit posture conversation starts.

2026 · CA SB 253/261
The US joins.

5,000+ companies report Scope 1, 2, 3 and climate-financial risk.

2027 · Wave 2 + RFPs
It hits procurement.

Mid-cap EU companies in scope. ESG in customer RFP terms by default.

2030 · Table stakes
The function is finance-adjacent.

EcoVadis, GRI, customer questionnaires, board ESG cadence are operating norms.

The shift in one line.

For two decades, corporate social impact reported up through Communications, HR, or the CEO’s office. The work was important; the audit posture wasn’t. That era worked because nobody was checking.

Now the CFO is in the room. The auditor is asking why this partner, why this dollar, why this disclosure number. The team that runs impact like a comms function is going to find itself rebuilding under pressure. The team that runs it like a finance function runs through the shift instead of catching up to it.

The function that can’t produce evidence loses its budget. The one that runs the discipline keeps it.

The strategic argument
The problem

Social impact functions break in predictable ways.

Four failure modes every operator I know has run into. Not category research; lived experience from running impact functions at scale.

01

It lives in one operator’s head.

Anchor partner relationships. Tier-change rationale. The “why we trust this nonprofit” story. All in one person’s memory. When that person leaves, so does the function.

02

It can’t answer “why this dollar?”

When the CFO, the auditor, or a customer’s ESG team asks why one partner got $2M and another got $200K, the answer comes from memory. The work is real; the audit trail isn’t.

03

It restarts every leadership change.

Average tenure for an impact lead is 18-24 months. Without continuity, every transition resets. Anchor partners drift. The board hears the same idea pitched twice.

04

Disclosures get rebuilt every cycle.

EcoVadis. SB 253/261. GRI. Customer RFPs. Same data, five different formats, five overnight crunches per year. The team becomes a disclosure-assembly line instead of a function.

What we’ll build

What Patricia means for the function you’re hiring me to lead.

The platform is the thesis. The function I build for you is the practice.

Patricia isn’t something to buy. It’s what I’d build inside your function from day one, drawn from the same operating model Patricia is built around.

DAY 90

The function has a memory.

  • Decision log is live. Every funding call has rationale, sponsor, evidence.
  • Anchor partner roster mapped, tiered, on cadence.
  • Quarterly board narrative outlined against real evidence.
DAY 180

Audit-ready, not audit-prepped.

  • SB 253/261 and EcoVadis posture defensible without a fire drill.
  • Anchor partners on quarterly executive cadence.
  • One inventory feeding board, auditor, customer, regulator.
YEAR 1

The function outlasts me.

  • Successor pack ready on demand.
  • Function operates with 5-year-operator institutional memory.
  • Board reports the function is auditable, predictable.

The math: hire the person who’s already designed the operating model and you skip the 18 months of trial-and-error every new impact lead runs through. You get the thinking. The role becomes the practice.

The product

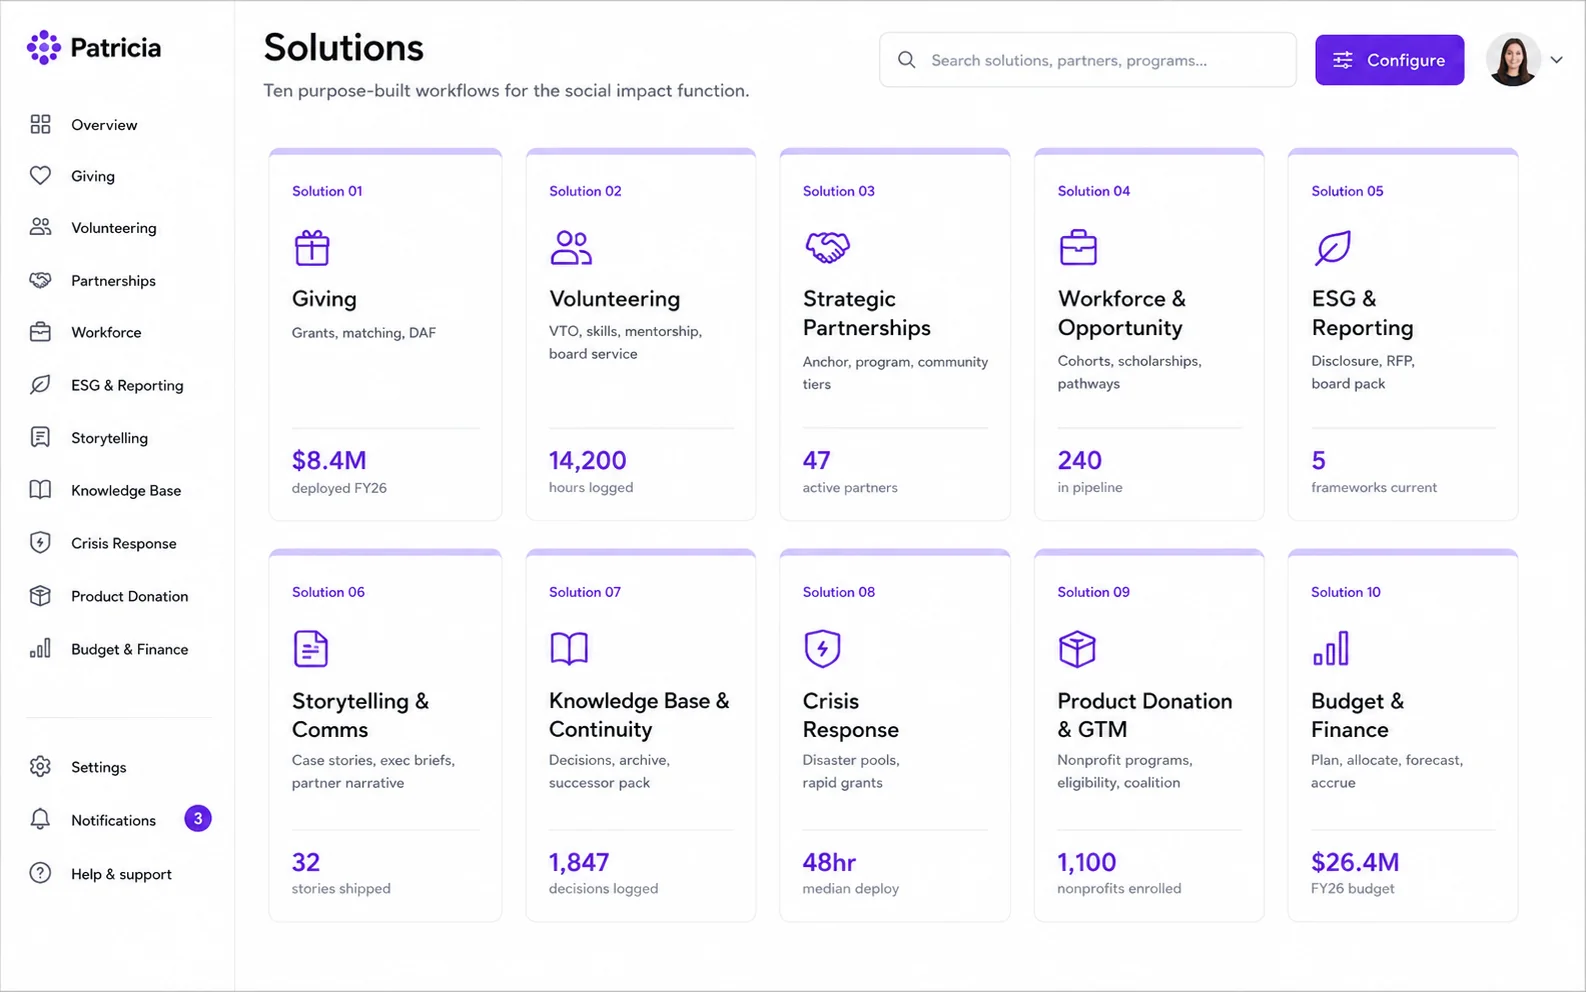
The operating system for social impact teams.

A purpose-built operating layer for the social impact function. Ten solutions, end-to-end, drawn from real impact work at Salesforce, Splunk, PlayStation, Proofpoint, Box, and Twilio.

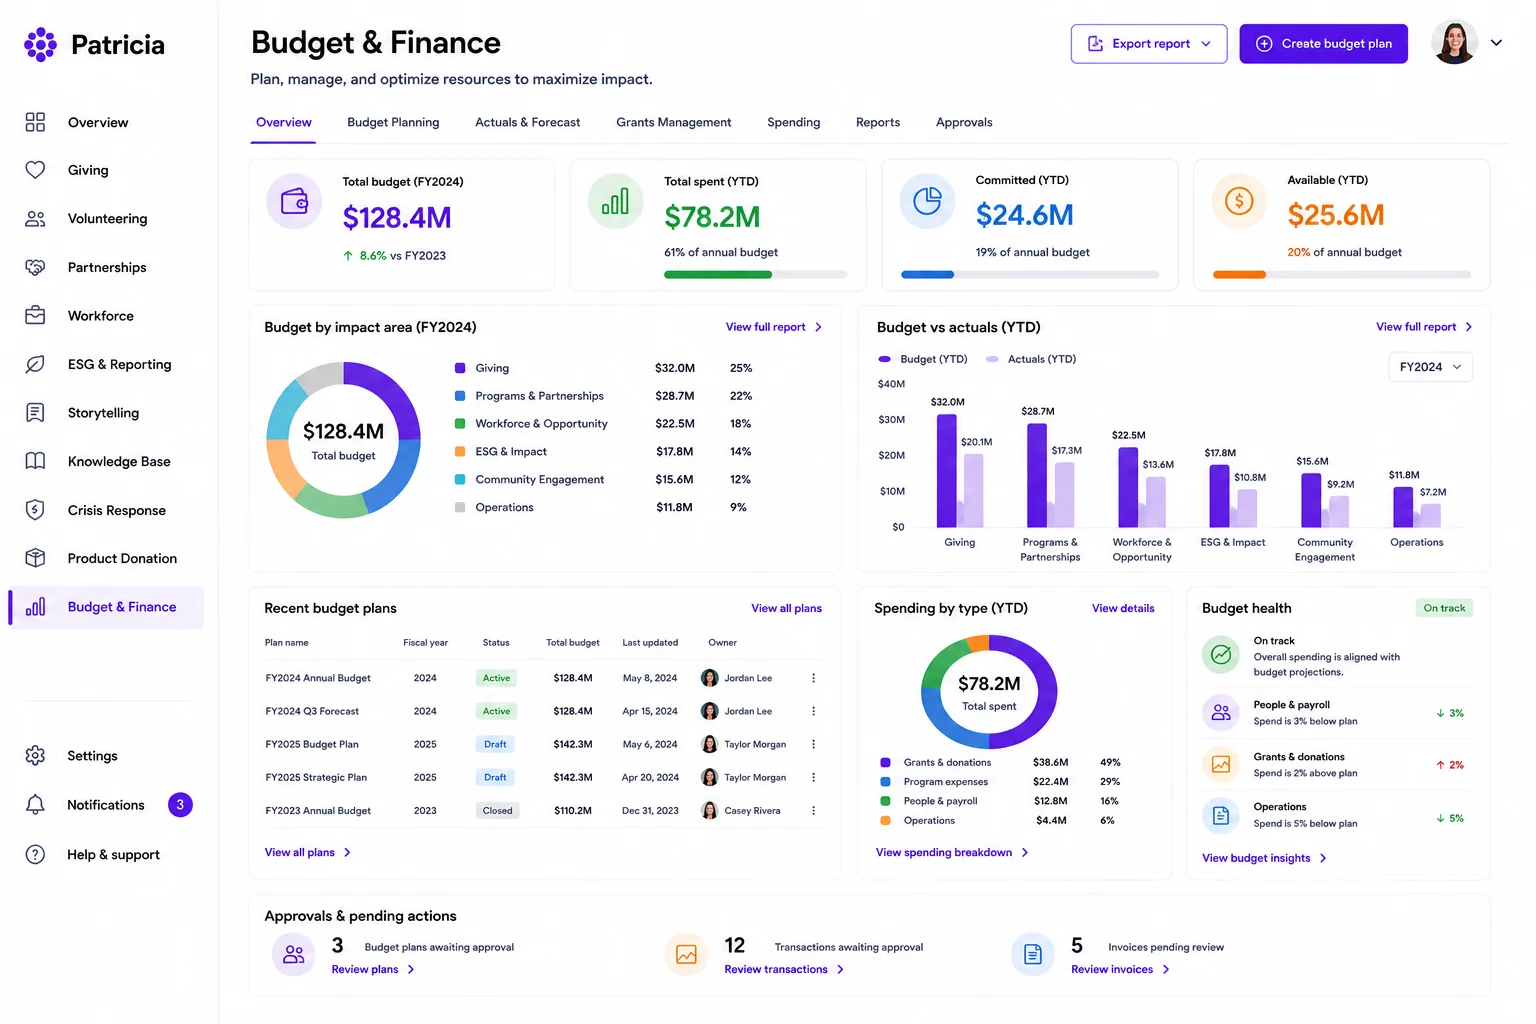
Patricia solutions home dashboard
Features

Ten solutions. Click any to expand.

Each one: the design choices behind it, the operating model that produced it, what it looks like in practice. Built from real work that shipped, not theoretical.

giving
Giving thumbnail
Solution 01

Giving

Corporate philanthropy, foundation grants, matching gifts, DAF disbursements.

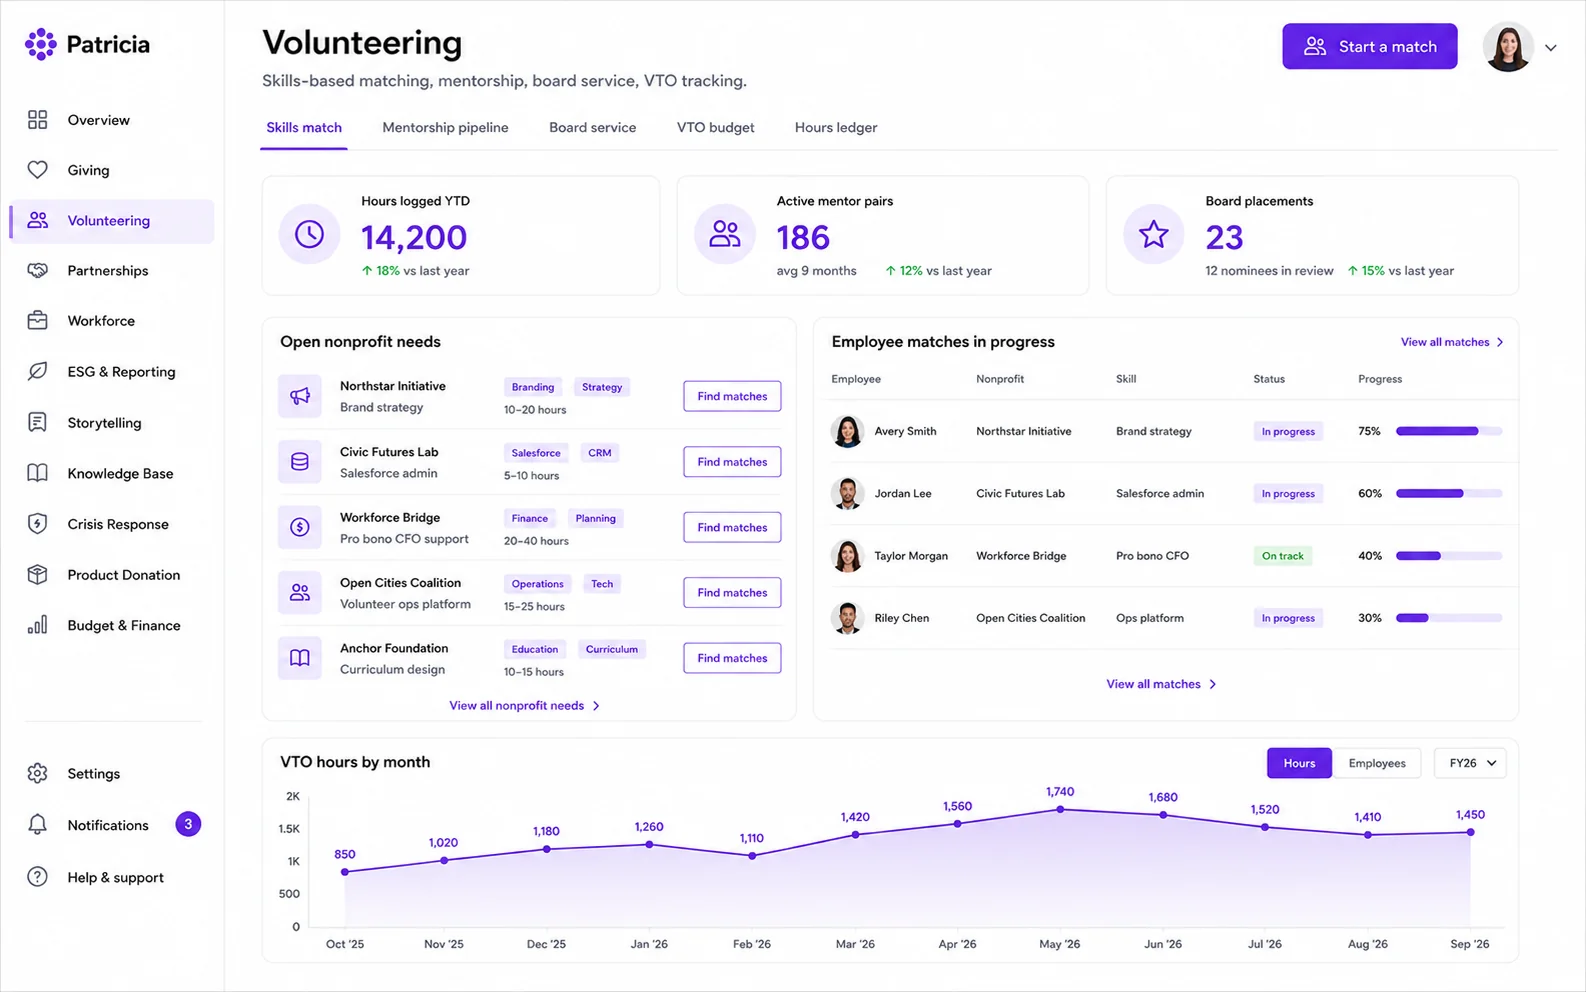
volunteering
Patricia volunteering thumbnail
Solution 02

Volunteering

VTO, skills-based, mentorship, board service coordination.

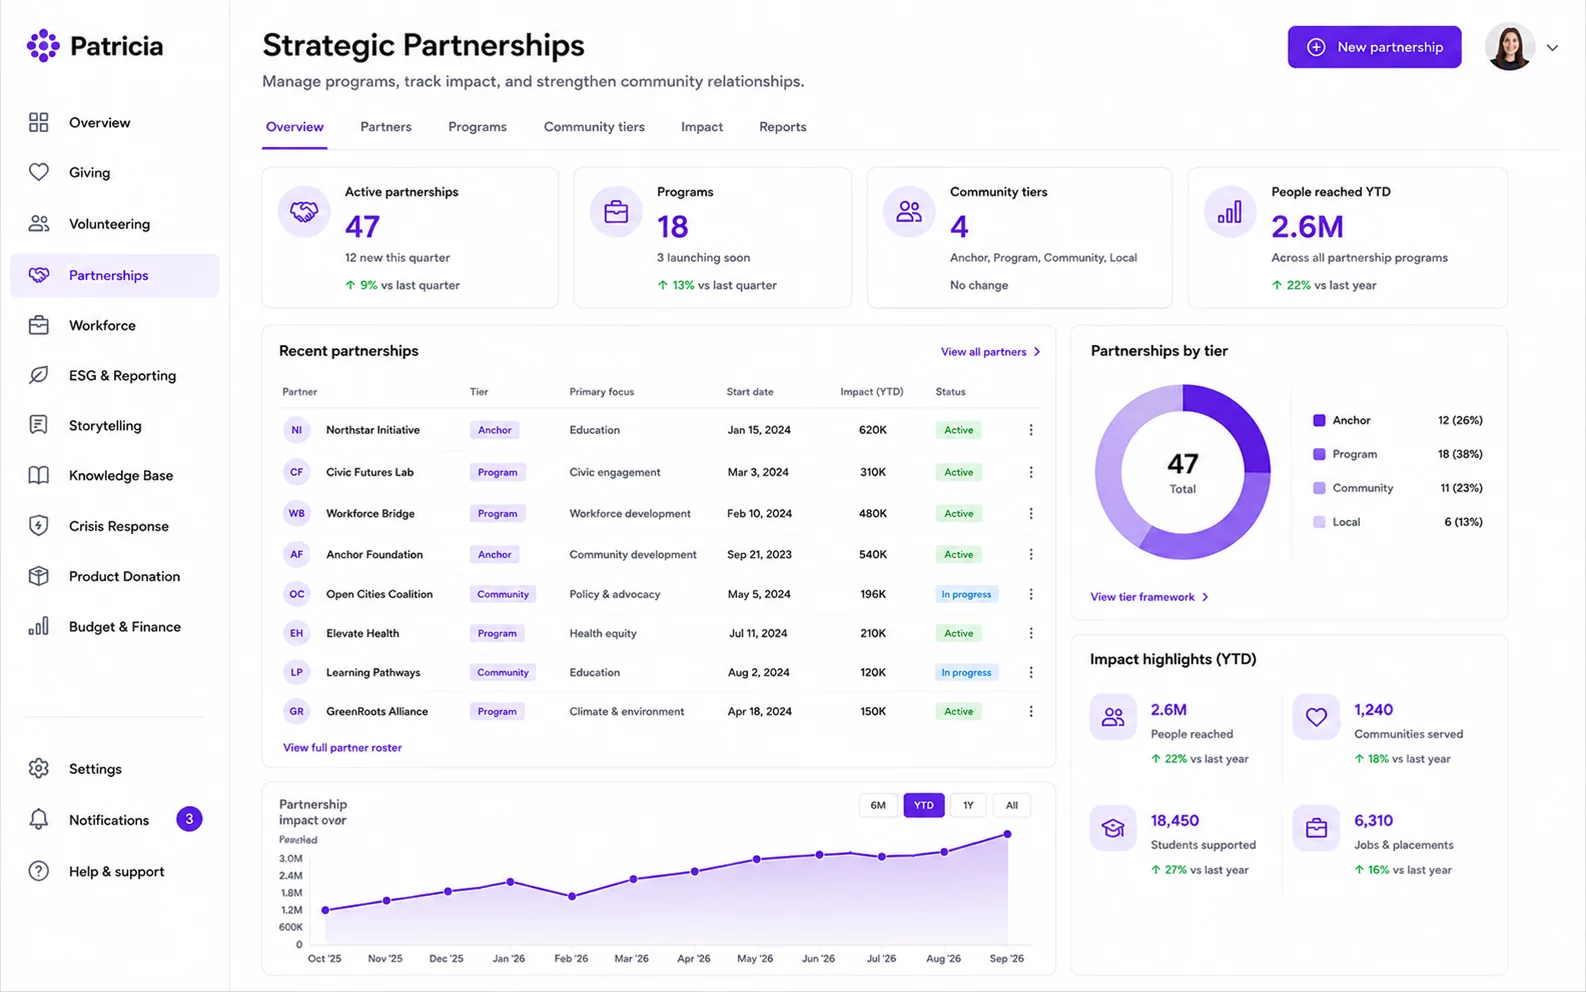
partnerships
Patricia partnerships thumbnail
Solution 03

Strategic Partnerships

Multi-year anchor nonprofit relationships, structured.

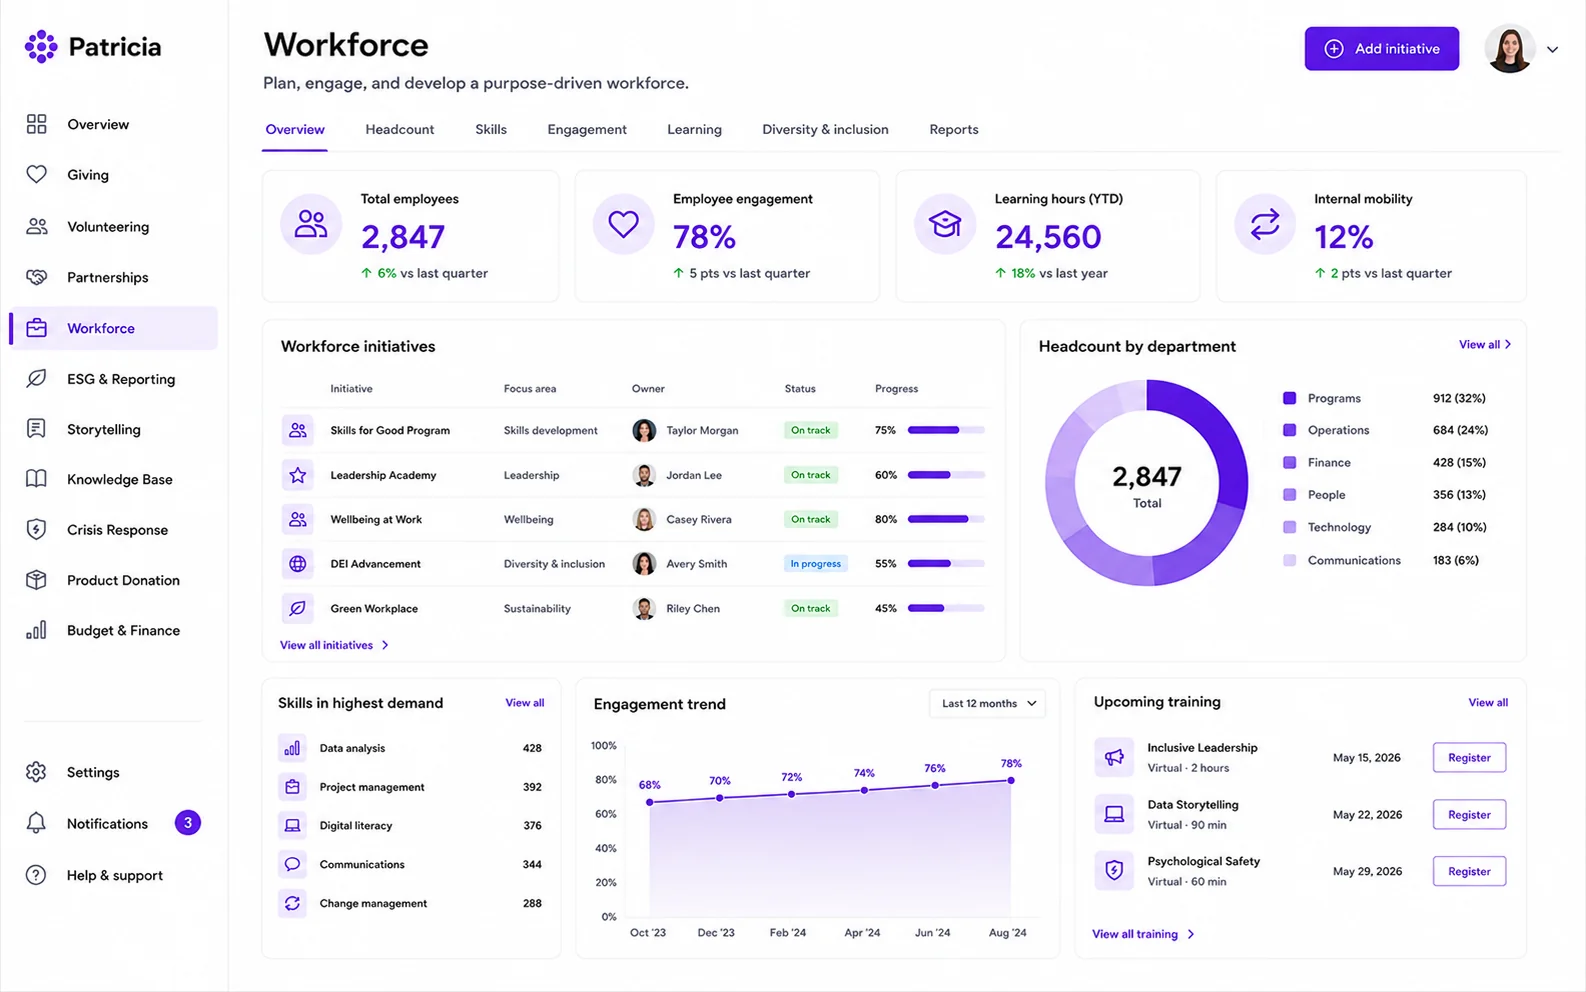
workforce
Patricia workforce thumbnail
Solution 04

Workforce & Opportunity

Workforce dev, scholarships, cohort programs, talent pipelines.

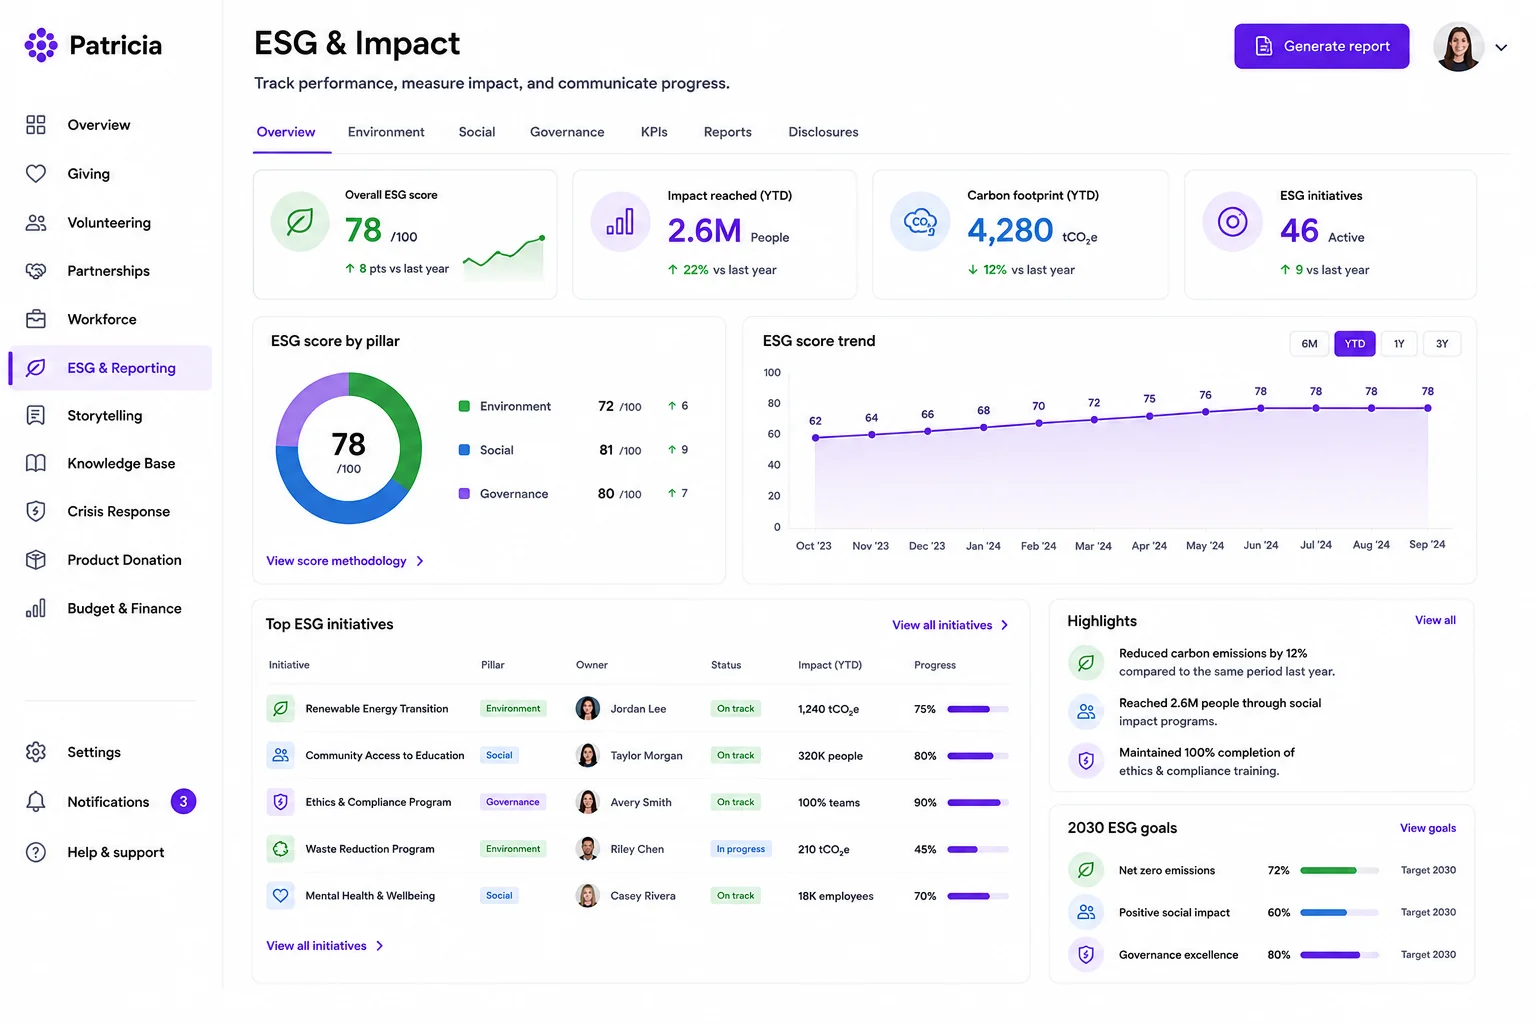
esg
Patricia esg thumbnail
Solution 05

ESG & Reporting

Sustainability framework, regulatory filings, customer RFPs, board pack.

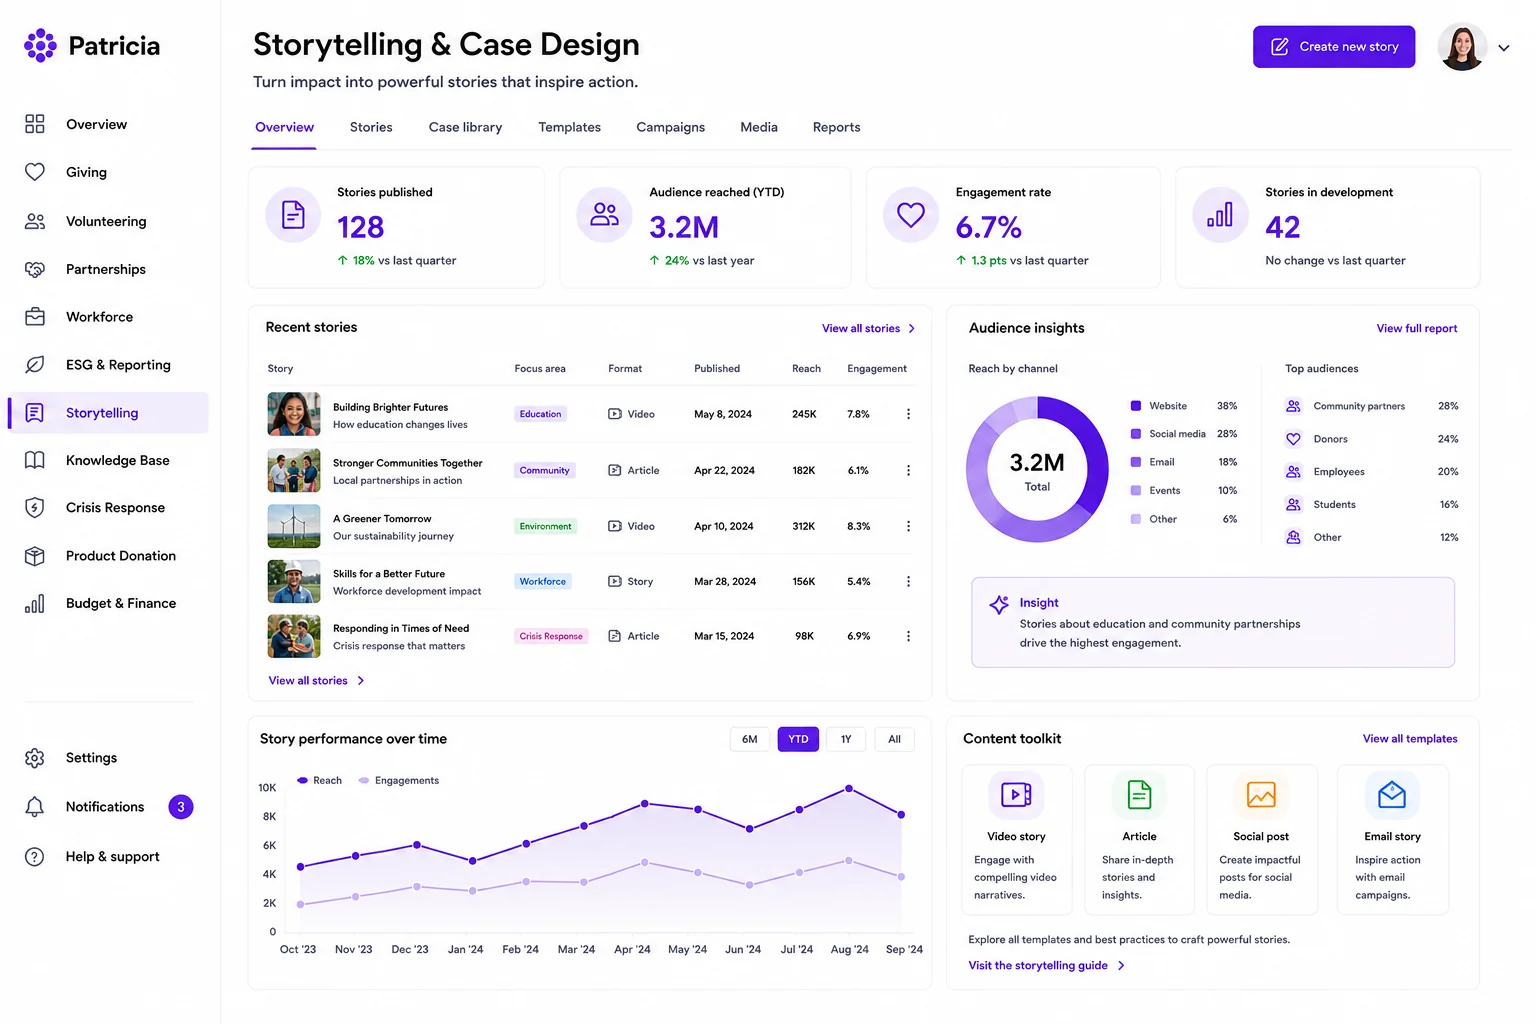
storytelling
Patricia storytelling thumbnail
Solution 06

Storytelling & Comms

Case stories, executive briefs, internal narrative, external comms.

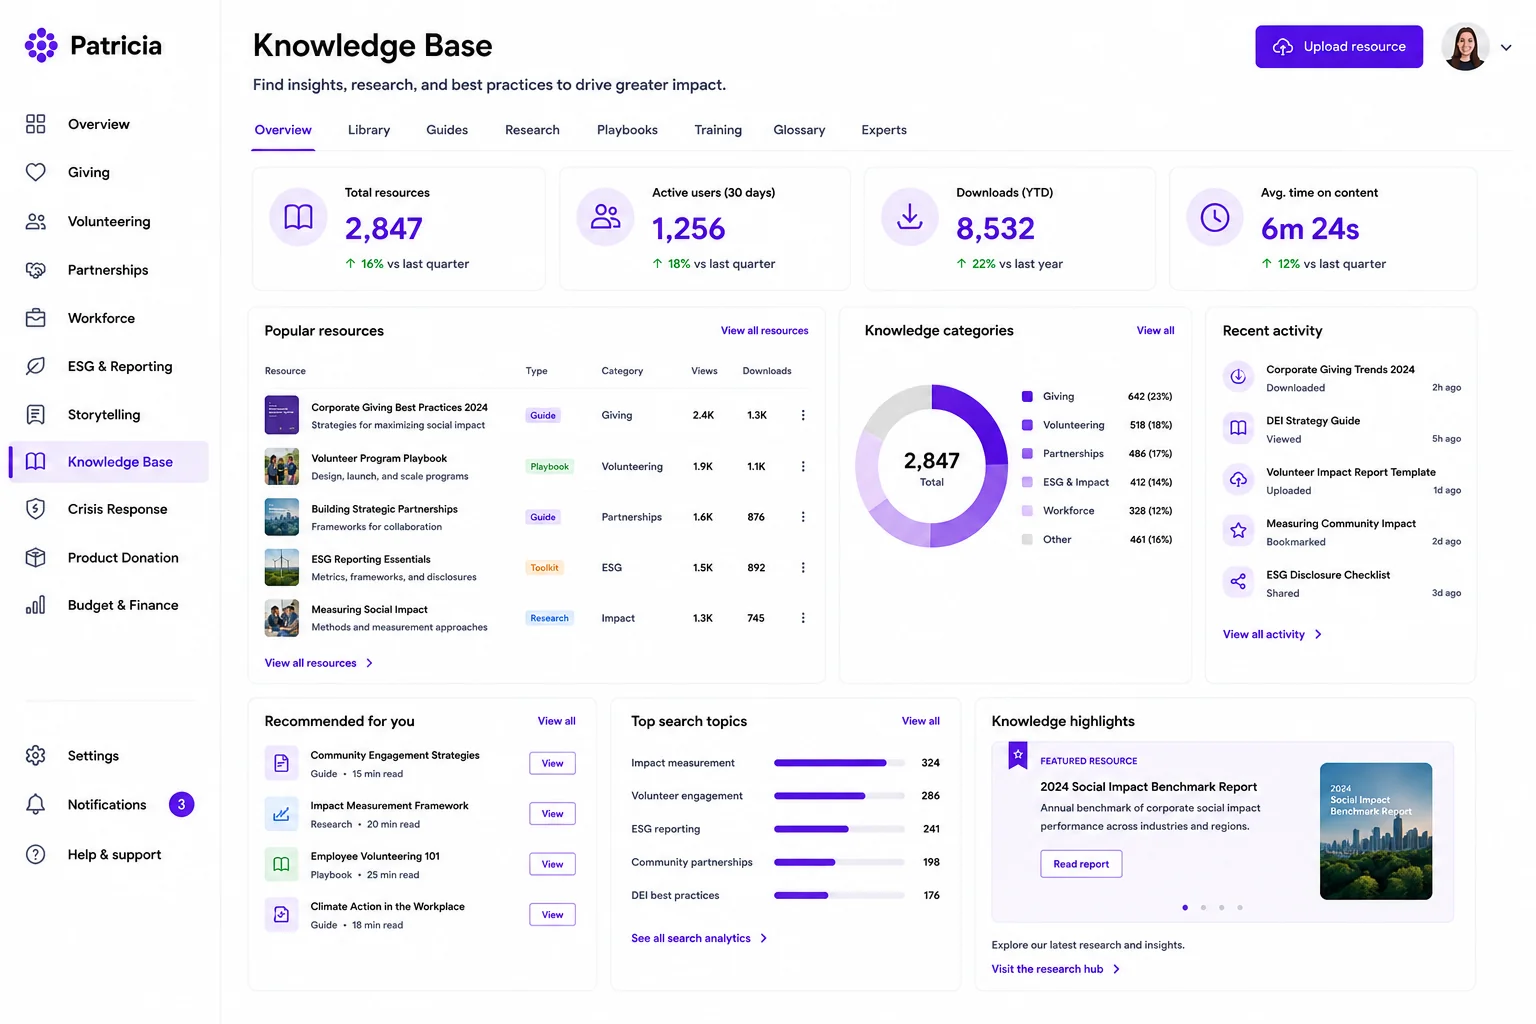
knowledge
Patricia knowledge thumbnail
Solution 07

Knowledge Base & Continuity

Institutional knowledge, decision archive, successor pack.

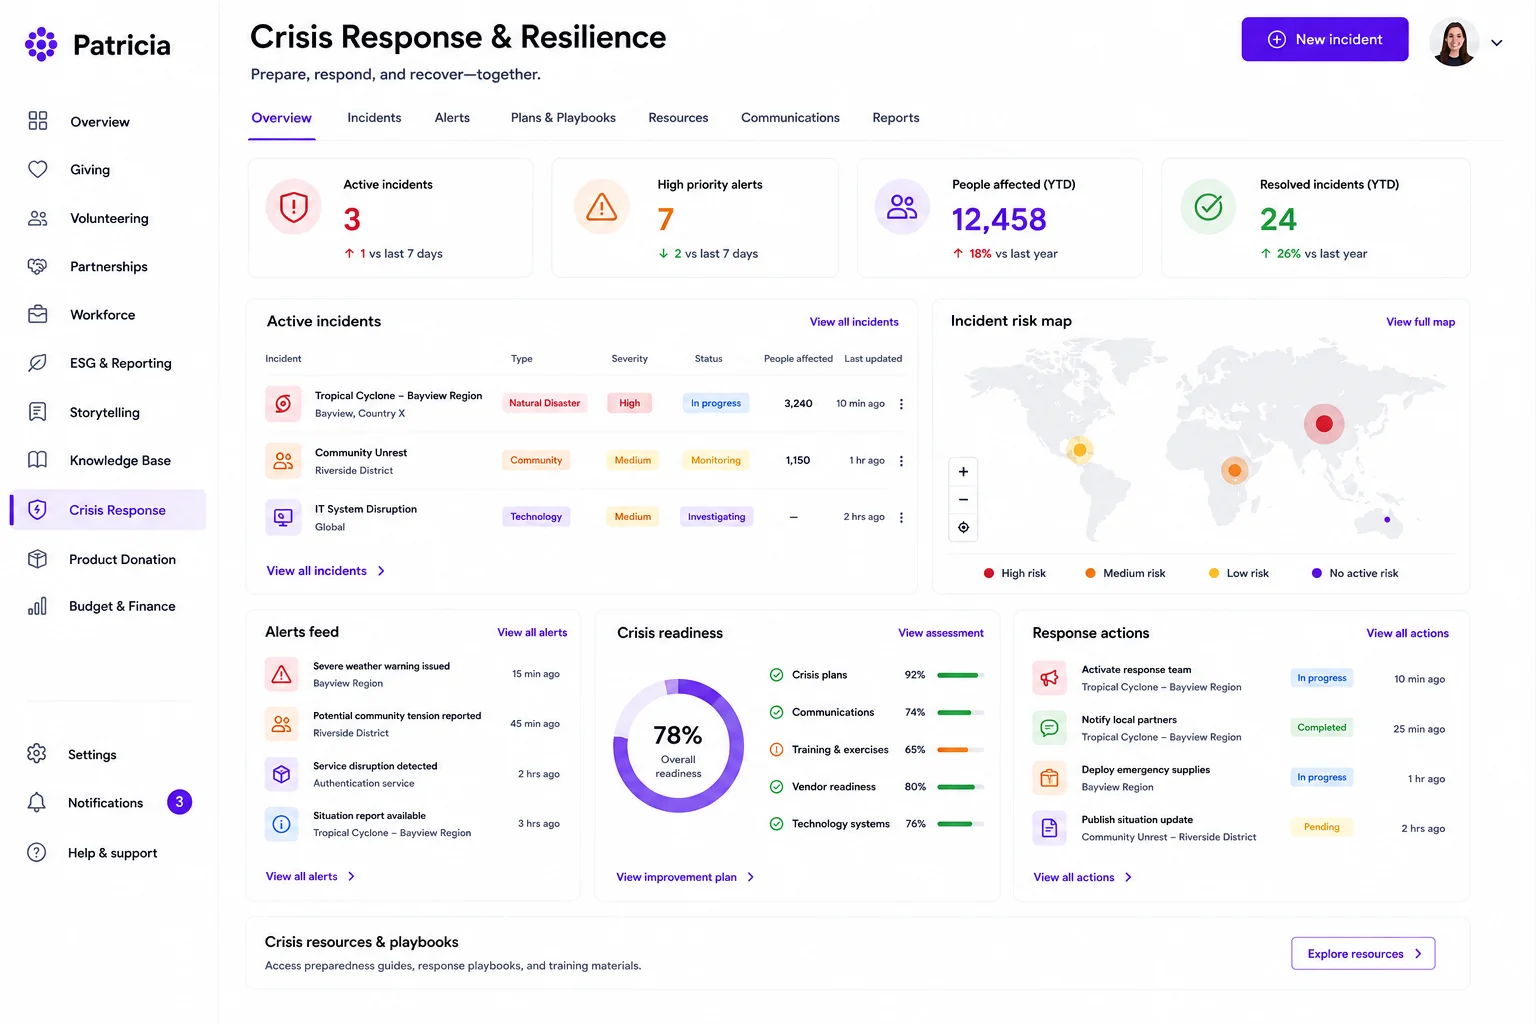
crisis
Patricia crisis thumbnail
Solution 08

Crisis Response

Disaster activation, social-moment rapid response, rapid grants.

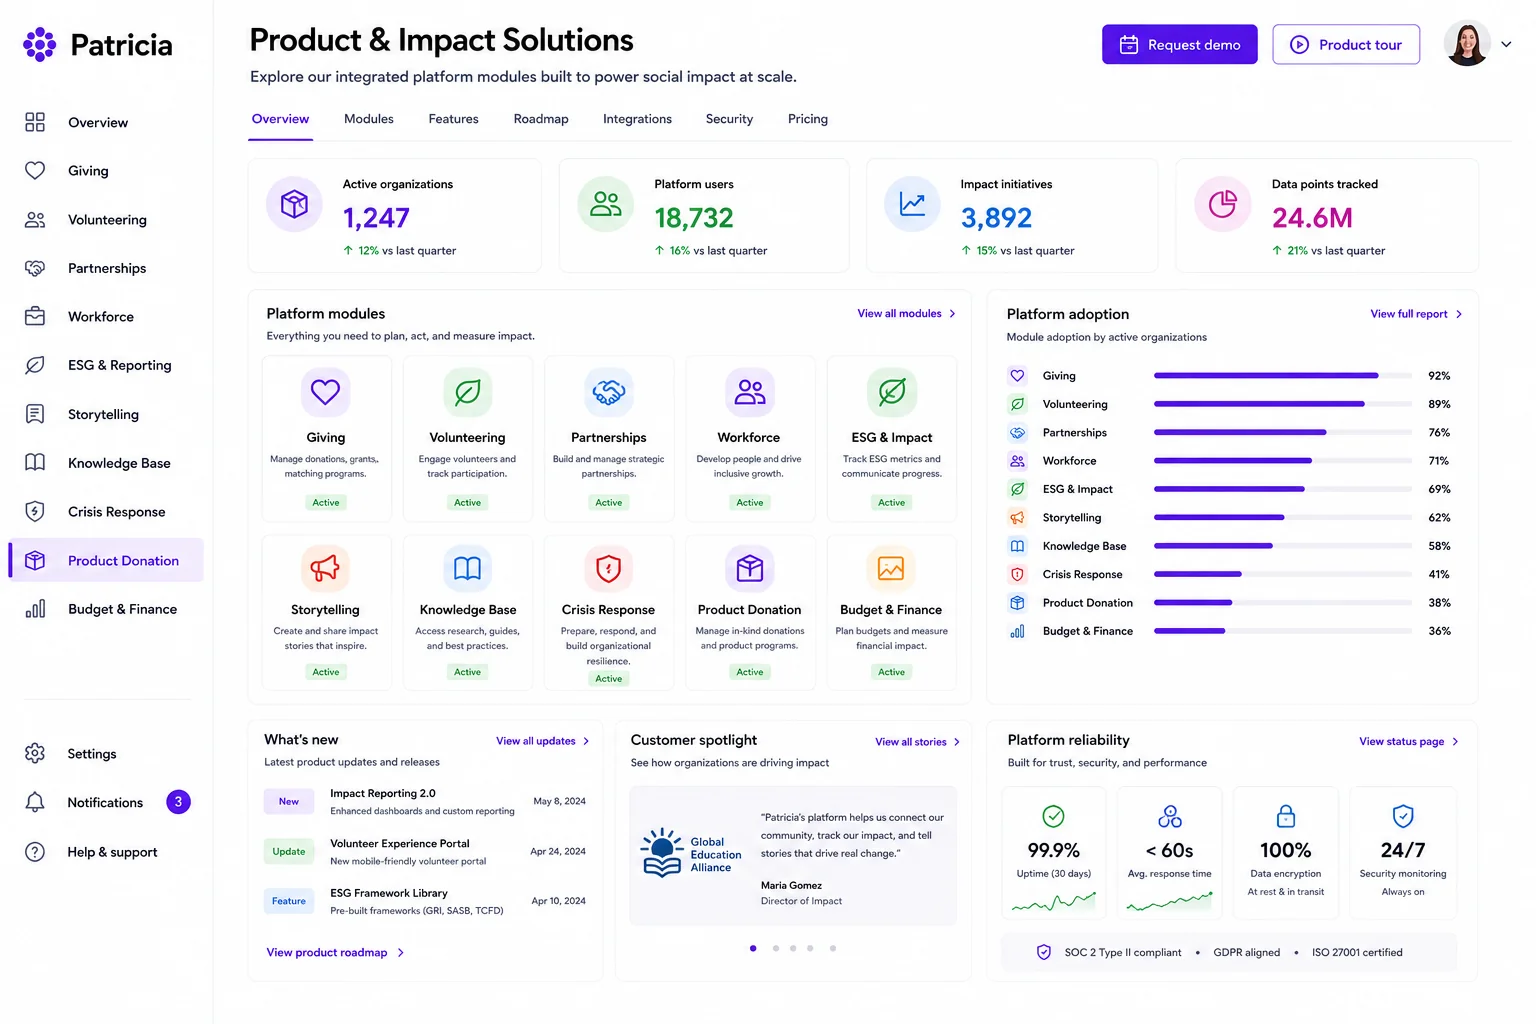
product
Patricia product thumbnail
Solution 09

Product Donation & GTM

Donate-and-grow product into the social sector with NPSP-style programs.

budget
Patricia budget thumbnail
Solution 10

Budget & Finance

Annual budget, allocation, spend tracking, forecasting, accruals.

Click any solution above to see the deep dive below.
Solution 01 · Giving

Corporate giving, end-to-end.

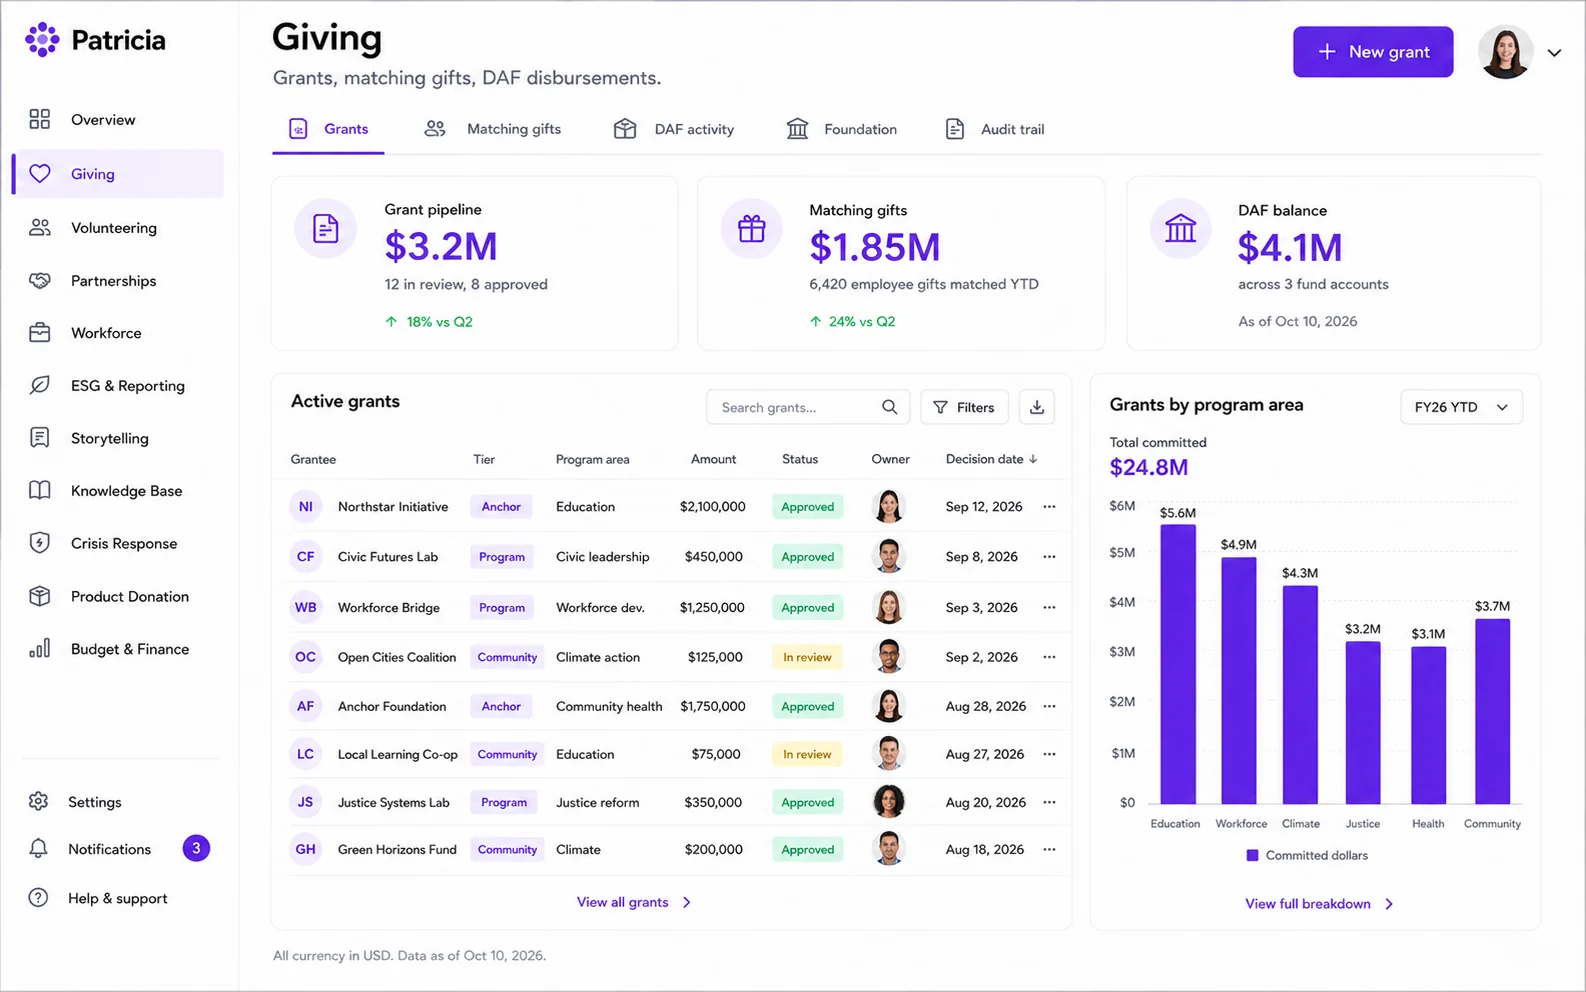
Grant disbursement, matching gift programs, employee giving, DAF management. From the application to the audit trail.

  • Grant disbursement with review committees and conflict-of-interest checks.
  • Matching gift programs with budget caps and payout tracking.
  • DAF workflow with grantee compliance and multi-year award tracking.
  • Foundation governance for separate 501(c)(3) operations.
Patricia Giving dashboard: grant pipeline, matching gifts, DAF disbursements
Solution 02 · Volunteering

Volunteering, coordinated.

The operator-side coordination of employee and leader engagement. Not the donation rails — the matching, scheduling, and tracking that turn participation into outcomes.

  • Skills-based volunteering matching employee capability to nonprofit need.
  • Mentorship pipelines with pairing, scheduling, outcome tracking.
  • Board service coordination: nominate, sponsor, support placements.
  • VTO budget and hours tracking across the workforce.
Patricia volunteering dashboard
Solution 03 · Strategic Partnerships

Run partnerships the way they actually work.

Multi-year, multi-mechanism relationships need more than a CRM contact and a renewal date. Treat every partnership as a long-term relationship with structure, history, and continuity.

  • Anchor / Program / Community tiers, each with its own cadence and playbook.
  • Touchpoint history for successor leads and continuity.
  • Renewal lifecycle on the partnership’s timeline.
  • Co-investment tracking and joint commitment management.
Patricia partnerships dashboard
Solution 04 · Workforce & Opportunity

Pathways to opportunity, end-to-end.

Run sustained workforce and opportunity work as products: design, intake, execution, outcomes. The pipeline from access to placement to long-term career trajectory.

  • Program design + intake with applications, review committees, scoring rubrics.
  • Cohort execution with milestones, mentor matching, partner coordination.
  • Leading indicators mid-cohort to catch drop-off before placement.
  • Multi-year scholarship and pathway tracking with placement and progression outcomes.
Patricia workforce dashboard
Solution 05 · ESG & Reporting

One inventory. Every external audience.

Captures data once and generates the format on demand. Team stops being a disclosure-assembly line and starts running an impact function.

  • One source of truth across partner, program, and disclosure data.
  • Generated outputs for SB 253/261, EcoVadis, GRI, CDP, CSRD.
  • Customer RFP responses in days, not consultancy weeks.
  • Board pack auto-assembled with traceability to source.
Patricia esg dashboard
Solution 06 · Storytelling & Comms

Develop the comms and content the function needs.

The function’s voice. Generative, not bolted on after. Patricia develops the narrative AND coordinates the comms as the work happens.

  • Case story generation with evidence, voice, audience-fit.
  • Executive briefs for CEO, CFO, and board, drawn from real data.
  • Internal comms for ERG channels, all-hands, employee narrative.
  • External comms and media coordination tied to program and campaign milestones.
  • Partner storytelling: nonprofit case stories, joint announcements, co-branded moments.
Patricia storytelling dashboard
Solution 07 · Knowledge Base & Continuity

Functions that survive operator transitions.

Average tenure for an impact lead is 18-24 months. Anchor partnerships are 5-10 years. The math doesn’t work without institutional knowledge built in. Patricia is the function’s memory.

  • Decision archive with full rationale, sponsor, and evidence preserved.
  • Knowledge base of partner profiles, program learnings, and operating precedent.
  • Anchor relationship handoff packages auto-assembled per partner.
  • Successor pack ready any day, not three months of re-discovery.
  • Function durability through reorgs, leadership changes, and team turnover.
Patricia knowledge dashboard
Solution 08 · Crisis Response

Rapid response, ready before the moment.

When disasters strike or social moments emerge, the function activates fast. Patricia handles the workflow: deploy funds in 48 hours, coordinate partner network, fast-track comms, capture rationale.

  • Pre-positioned rapid-response grant pools, ready to deploy.
  • Partner network activation for emergent moments.
  • Fast-track comms approval flows with stakeholder sign-off.
  • Post-response capture and reporting for board and stakeholders.
Patricia crisis dashboard
Solution 09 · Product Donation & GTM

Product into the social sector. Strategic and durable.

Donate product (software, services, devices) to nonprofits with the dual benefit of real impact and a long-term pipeline. The donate-and-grow operating model that Salesforce, Splunk, Box, and Tableau all use.

  • Nonprofit program design (Splunk for Good, NPSP-style).
  • Eligibility, vetting, and grantee management at scale.
  • Coalition design with peer companies for sector-wide impact.
  • Pipeline tracking: nonprofit grantees to enterprise customers over time.
Patricia product dashboard
Solution 10 · Budget & Finance

Run the function’s money like a finance function.

The annual budget, allocation across solutions, spend tracking, multi-year planning, variance reporting. Patricia replaces the finance-team spreadsheet with a real budget and finance layer that speaks the CFO’s language.

  • Annual budget setup with allocation across the ten solutions and approval workflow.
  • Spend tracking against committed dollars in real time, no end-of-year reconciliation.
  • Multi-year planning and forecasting for partner MoUs, program commitments, and the next budget cycle aligned to your corporate calendar.
  • Variance reporting (plan vs. actual) defensible at the CFO conversation.
  • Accruals and journal entries generated for the finance team, audit-traceable.
Patricia budget dashboard
Outcomes

Beyond the tools: Eight function-level wins.

What changes when nine tools run as one operating system. Cross-cutting outcomes the function produces, not what individual tools deliver. These map to what your CFO, your auditor, your board, and your team are going to measure.

Time
4.5hrs/wk back
Per operator. ~13 days/quarter team-wide.
From assembly to execution.
  • Monday-morning prep from 5 hrs to 30 min.
  • Board pack from 2 weeks to 3 days.
  • Operator transition from 3 months to days.
Operating rigor
100%logged
Decisions logged at the moment. Patterns enforced.
Discipline you can audit.
  • Every funding call documented with evidence.
  • Tier playbooks enforce cadence automatically.
  • Operating patterns drawn from shipped functions.
Risk
Audit-ready
Audit posture, ready. No fire drill.
Compliance: defensible by design.
  • One inventory feeds SB 253/261, EcoVadis, GRI, RFPs.
  • Source-to-disclosure trail on every line.
  • Auditor walk-through in hours, not weeks.
Cost
$0needed for consultants
ESG advisory, audit prep, board narrative. All in-house.
From external help to in-house.
  • Templates + reporting replace big-4 ESG retainer.
  • Customer RFPs in days, not consultancy weeks.
  • Audit prep external help eliminated.
Capacity
Scaled management
Portfolio managed, same team.
Scale without growing the team.
  • 47 partners by the team that managed 20.
  • Cohort throughput up 3x per program lead.
  • Tier playbooks do the leverage.
Continuity
Day-1 handoff
Handoff. Successor pack any time.
Every transition becomes a non-event.
  • Decision archive preserves rationale through change.
  • Anchor relationships hand off cleanly.
  • Institutional memory survives reorgs.
Stakeholder trust
One source
All seeing the same evidence base.
Function reads cleanly to every audience.
  • Board: auto-assembled narrative tied to evidence.
  • CFO: rationale on every funding call.
  • Auditor + ESG teams: one source of truth.
Mission impact
Less overhead. More mission.
Dollars stop getting eaten by overhead.
Dollars reach the work.
  • Less prep/audit overhead = more to programs.
  • Tier playbooks help partners deliver better outcomes.
  • Multi-year continuity compounds partnerships.
Integrations

Patricia connects to where your data already lives.

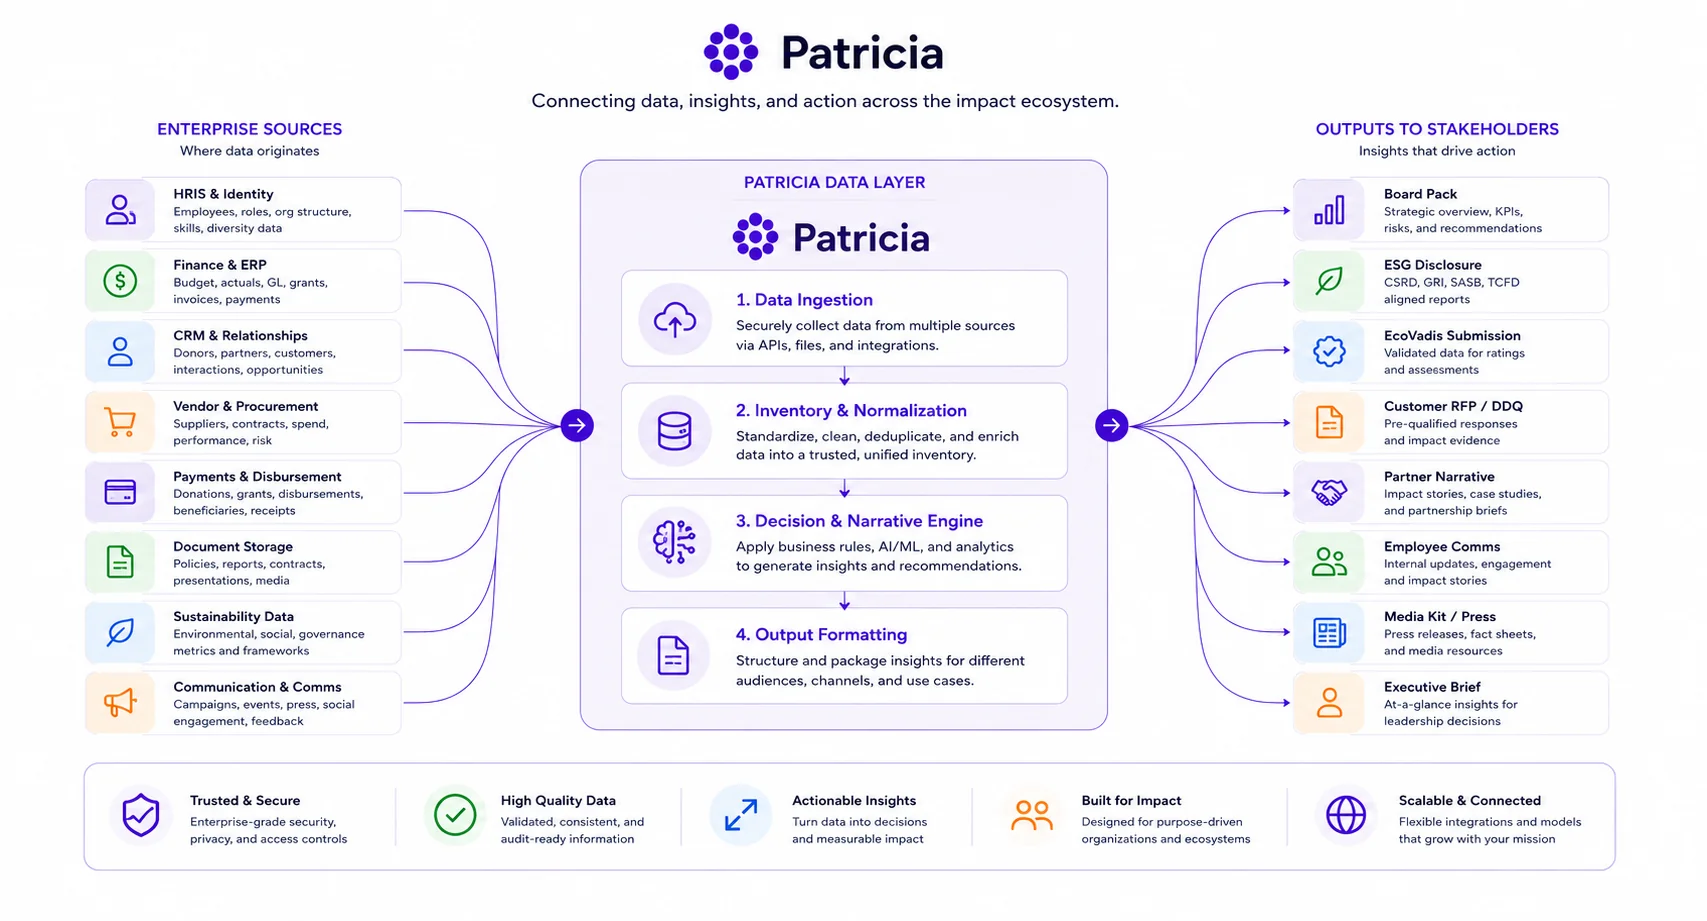
Impact data is scattered across HRIS, ERP, CRM, vendor management, payment platforms, disclosure systems, and document stores. Patricia pulls from all of them so the team isn’t manually reconciling. Integrations are the foundation, not the afterthought.

How it works

From scattered systems to one inventory.

Your enterprise stack feeds Patricia’s data layer. The ten solutions turn that into the work, comms, budget, and content. The outputs go where they need to go.

Patricia data flow: enterprise sources to Patricia data layer to outputs
Connects to

Eight categories. One source of truth.

Where your data lives today, and how Patricia plugs into it. Built around the enterprise systems your IT team already supports.

01
HRIS & Identity

Employee data, org chart, directory. Patricia pulls who works for you and how they’re organized.

WWorkday
BBambooHR
OOkta
SSAP SuccessFactors
MMicrosoft AD
02
Finance & ERP

Budget, spend, cost centers, GL data. Patricia pulls dollar amounts and ties them to programs and partners.

NNetSuite
SSAP
OOracle
SSage Intacct
QQuickBooks
03
CRM & Relationships

Nonprofit partners, contacts, touchpoint history. Patricia pulls the relationship graph that informs partnership tiering.

SSalesforce
HHubSpot
MMicrosoft Dynamics
PPipedrive
04
Vendor & Procurement

Nonprofit vendor records, contract data, sourcing pipeline. Patricia connects partnerships to procurement reality.

CCoupa
AAriba
WWorkday SS
JJaggaer
05
Giving & Volunteering

Employee gift data, volunteer hours, matched funds. Patricia treats these as data sources, not competitors.

BBenevity
BBonterra
SSubmittable
MMillie
YYourCause
06
Disclosure & Sustainability

Climate data, ESG ratings, regulatory filings. Patricia layers community-investment data into the disclosure stack.

WWorkiva
WWatershed
PPersefoni
EEcoVadis
NNovata
07
Communication & Decisions

Where decisions actually get made. Patricia captures rationale from the channels you already use.

SSlack
MMicrosoft Teams
GGoogle Workspace
NNotion
LLinear
08
Document & Evidence

Contracts, MoUs, partner agreements, evidence artifacts. Patricia keeps the audit trail tied to the source documents.

SSharePoint
GGoogle Drive
BBox
CConfluence
DDocuSign
IT setup

The plumbing list. Low-risk by design.

What Patricia asks of your IT team to plug in. Every connector follows least-privilege and read-only patterns.

01
Read-only API access to HRIS
Service account or OAuth client. Patricia pulls employee data, org chart, directory. Never writes back.
Read-only · low risk
02
OAuth handshake on the CRM
Salesforce, HubSpot, Dynamics. Patricia uses your team’s existing OAuth app. No new credentials issued.
Least-privilege
03
Read-only ERP connector
NetSuite, SAP, Oracle. Patricia reads budget, spend, GL data. Common patterns IT already supports.
Read-only · audit-logged
04
Service account in document storage
SharePoint, Google Drive, Box. Patricia scoped to the impact-function folder tree. No broader access.
Least-privilege · folder-scoped
05
Optional: webhook on decisions
For real-time decision archive (board approvals, partner renewals). Optional, drop-in event payload.
Optional · drop-in event
Module 01 · Partnerships

Run nonprofit partnerships the way they actually work.

Multi-year, multi-mechanism nonprofit relationships need more than a CRM contact and a renewal date. Patricia treats every partnership as a long-term relationship with structure, history, and continuity that survives the people running it.

patricia.ai/partnerships
Foundation HQ / Partnerships
AC

Partnerships

47 active · 6 in renewal · $24.7M total commitment
Filter+ New partnership
All · 47Anchor · 8Program · 22Community · 17
PartnerTierCommitmentTermStatusLast touch
UNCF
Anchor$2.0M3-yrIn review2 days
Per Scholas
Anchor$5.0M5-yrActive5 days
Year Up
Program$1.2MannualActive1 wk
Black Girls CODE
Program$400KannualRenewing3 days
What this is

A partnership is not a sales contact. It’s a multi-year relationship.

Most companies track nonprofit partnerships in a CRM that was built to close deals, one contact, one opportunity, one close date. That works for a B2B sale. It does not work for a five-year scholarship pipeline with three executive sponsors, two program leads, and a board chair you check in with twice a year.

Patricia’s Partnerships module is built around the way nonprofit work actually happens: long horizons, multiple touchpoints per quarter, decisions that need historical context, and reporting that auditors and customers will both eventually look at.

Why this matters to you

  • Your team will leave. The partnership shouldn’t restart when they do.
  • Your CFO and your auditor will eventually ask “why this partner, why this dollar.” You need an answer.
  • Anchor partners need quarterly executive cadence; community partners need batched annual review. Not the same playbook.
  • Renewal windows close on Salesforce’s timeline. They should close on yours.
Tier the portfolio

Anchor, Program, Community, each tier earns its own playbook.

Most partnership portfolios drift because everyone gets treated like the same kind of relationship. Patricia tiers the portfolio by depth and commitment, then runs the right cadence for each.

  • Anchor partners get quarterly executive review, multi-year MoUs, anchor-grade reporting.
  • Program partners get annual refresh, structured renewal, defined scope.
  • Community partners get a lighter, batched cadence so the team stays focused.
UNCF · Partnership detail
OverviewHistoryProgramsDocuments
Tier
Anchor
Commitment
$2.0M
Term
3-yr · Apr 26
Touchpoint history
MAR 12 · Quarterly check-in · Dr. M. Lomax
FEB 04 · 2026 cohort kickoff prep
JAN 18 · Multi-year structure aligned
Renewal alerts

Never miss a window or surprise an exec at renewal.

Patricia tracks renewal dates across the portfolio and surfaces what needs attention this quarter. Field teams see prep tasks; executives see a clean rollup.

  • 30/60/90-day renewal warning windows.
  • Auto-attached prep packs from past activity.
  • Mobile alerts when an anchor relationship is at risk.
Renewals
3 due in next 60 days
UNCF · 2026 cohort
Anchor renewal · 14 days
Per Scholas
Anchor renewal · 38 days
Black Girls CODE
Program renewal · 52 days
Open prep pack
How it works

Five steps from intake to active management.

A real partnership lifecycle, end to end. Each step is supported in the platform with the screenshot below it.

1

Define the strategic role

Before scoring or onboarding, name the role this partner plays in the portfolio. Anchor scholarship pipeline. Regional execution. Technical specialist. Without this, scoring becomes a beauty contest.

New partner intake
Strategic roleAnchor pipeline
Programs covered2
GeographiesUS-West, UK
2

Tier the relationship

Anchor / Program / Community based on commitment depth and strategic fit. Each tier carries a defined cadence, decision authority, and reporting expectation.

Tier assignment
Anchor (80+)8 partners
Program (60-79)22 partners
Community (<60)17 partners
3

Run on cadence

Anchors get quarterly exec review. Programs get annual renewal. Communities get a batched annual session. The cadence runs itself; you don’t schedule it from scratch every year.

This quarter
Anchor exec reviews8 / 8
Program renewals4 of 22
Community batchQ1 done
4

Capture decision context

Every meaningful change, scope expansion, tier promotion, dollar increase, gets logged with rationale. Six months later when an exec asks “why did we double down?”, the answer exists.

Decision · Mar 12
UNCF · 1-yr → 3-yrApproved
RationaleMulti-year cohort
ApproverBoard ESG
5

Re-tier on signals

Partners that have outgrown their tier get promoted. Partners drifting downward get a remediation plan or a graceful exit. The portfolio matches reality, not history.

Tier review
Promotions2 to Anchor
Remediation2 partners
Wind-down1 partner
What it produces

Real artifacts the module generates for you.

These are the documents and packs Patricia produces, the things you actually share with your CFO, your auditor, or your board.

Renewal prep pack

UNCF · 2026 cohort renewal

Generated Mar 5 · 14 pages · auto-assembled from 18 months of activity
Decision history
2024 · Initial $1M / 1-yrApproved
2025 · Extension to 3-yrApproved
Outcomes to date
56 enrolled, 52 on-track93%
12 internships placed21%
Open obligations
Mid-cohort reviewApr 18
For: Exec CommitteePDF · DOCX
Anchor partner brief

Per Scholas · executive sponsor handoff

Generated when sponsor changes · ready in 30 sec
Relationship
TierAnchor
Active since2017
Total commitment$5.0M / 5-yr
Key contacts
P. Ortiz · CEOMonthly
D. Lewis · COOQuarterly
What’s in flight
UK + DE expansionQ3 launch
For: New EDDOCX
Quarterly portfolio rollup

Q1 2026 partnership portfolio

Auto-generated for board ESG committee
Portfolio at a glance
47 active partnerships+6 YoY
$24.7M committed+$3.2M YoY
Tier mix
Anchor8 / 17%
Program22 / 47%
Community17 / 36%
Risk flags
2 partners on remediationWatch
For: BoardPDF
When you’d use this

Day-to-day moments where Partnerships does the work.

Monday morning

What needs my attention this week?

Open Patricia. See three anchor partners with renewal windows in 30 days, with prep packs already assembled.

Before a board meeting

Pull a clean portfolio rollup.

One click. Tier mix, commitment dollars, partners flagged for remediation. Nothing assembled by hand the night before.

Operator transition

Hand off a relationship in an hour.

The successor brief generates from existing history. The new operator inherits judgment, not a blank slate.

Sales CRMs were built for closing deals, not for tending five-year relationships across an executive director, a program lead, and a board chair. Patricia is built for the way partnerships actually run.

Aaron Chrisco · the operator pattern behind Patricia

Capabilities

Six things this module gives you that a CRM doesn’t.

Tiered partner structure

Anchor / Program / Community. Each tier has its own cadence, depth, and reporting expectations.

Long-term commitment tracking

Multi-year MoUs and 3-5 year scholarships handled natively, not crammed into single-line opportunity records.

Touchpoint history

Full conversation, decision, and meeting context. The relationship survives operator transitions.

Renewal lifecycle

30/60/90 day warning windows, structured renewal packs, exec rollups so nothing surprises you.

Document continuity

MoUs, grant agreements, exhibit attachments, tied to the relationship, not buried in a shared drive.

Decision context

Why we said yes. Why we changed scope. So the next operator inherits judgment, not just data.

Module 02 · Programs

Run programs as products, not events.

A program is a defined journey from a learner’s entry point to a measurable outcome, with stages, gates, milestones, and conversion rates. Patricia treats every workforce, scholarship, or platform program like a product with a real funnel.

Programs · Active
Career Pathways
Enrolled
56
On track
52
Apprentice Pathway
Active
28
Convert
9
SplunkWork+
Trained
800+
Placed
480
Aloy’s Forest
Activated
120M
Trees
600K
What this is

A program is a journey, not a calendar of activities.

Most workforce, scholarship, and platform programs run as a series of events, trainings, panels, kickoffs, certifications. Counted as activity, they look productive. Counted as outcomes, most can’t answer the basic question: how many people who entered actually came out the other side?

In Patricia, a program has explicit stages, named gates, defined drop-off points, and a conversion outcome you can measure. Apply → enrolled → mid-term → placed. Or trained → certified → placed → retained. The journey is visible. The drop-offs become design problems, not statistics.

Why this matters to you

  • You can’t improve what you can’t see. Stage-by-stage visibility tells you exactly where to fix.
  • Cohort comparison turns “is this working?” into a real answer with two real numbers.
  • Cost per placement is your unit economic. Patricia surfaces it; the spreadsheet stack hides it.
  • When the CFO asks “what did $30K per learner buy us?”, you have a defensible answer.
Five views, one program

Every program has a stage. Every stage has a screen.

Cohort funnels, milestone trackers, drop-off analysis, conversion benchmarks. Each card below is a real view inside Patricia.

Cohort funnel

Apply → enrolled → on-track → placed.

The journey explicit, the drop-offs visible, the conversion measurable.

Apply220
Enrolled56
On-track52
Placed9
Milestone gates

Each stage has a named gate.

✓ Onboarding56/56
✓ Mid-term52/56
· Capstone
Drop-off analysis

See where learners stall.

Stage 14% drop
Stage 27% drop
Stage 322% drop
Cohort comparison

Cohort 2 vs Cohort 1.

C1 conversion43%
C2 conversion50%
Cost per placement

Honest unit economics.

Career Pathways$30K
SplunkWork+$8K
Apprentice$22K
Anatomy of a program

Five parts that make a program a product.

A real program in Patricia has these parts. They’re not steps to follow, they’re the structure that makes the program legible, measurable, and improvable.

A

The population

Who is this for? Apprentice-eligible, scholarship-eligible, transitioning veteran. Made explicit, not implicit.

B

The stages

Apply → enrolled → on-track → placed. Named gates between each stage.

C

The partners

One per stage, scored on execution. Recruit, train, place, rarely the same partner.

D

The indicators

Leading (mid-cohort) and lagging (post-cohort). Both required to know whether it’s working.

E

The outcome

Specific, time-bound, falsifiable. “Place 30 engineers, 70% retained at 24 months.”

Apprentice → FTE
A · Apprentice eligible D · 6 indicators
B · Stages
Active
28
Mid-term
18
Convert
9
C · Partners
Recruit: Per Scholas Place: Internal
E · Outcome target
50% apprentice → FTE conversion / 70% retained 24mo
What it produces

Real outputs from a real cohort.

These are the artifacts the Programs module generates, the things you actually share with your CFO, your partners, and your board.

Cohort scorecard

Apprentice cohort · Q1 2026 mid-cohort

Generated weekly · sent to program team + sponsor
Funnel state
Active28 of 28
Hit mid-term gate18 of 28
Leading indicators
Attendance > 90%On
Mentor cadenceFlag · 76%
Forecast
Q2 placement~50%
For: Program teamPDF
Cost-per-placement memo

Career Pathways · unit economics

Generated for finance review · cite-able at budget
Cohort costs
Total program$1.68M
Per learner enrolled$30K
Per placement$140K
Compare
SplunkWork+ per placed$8K
Apprentice per converted$22K
Recommendation
Shift mix toward apprenticeQ2
For: CFODOCX
Partner-facing impact pack

UNCF · Career Pathways outcomes Q1

Quarterly pack for the partner ED
This cohort
Enrolled scholars56
Internships placed12
Cumulative since 2024
Total scholars112
Placement rate21%
Recognition
Awards & coverage3 mentions
For: UNCF EDPDF
A real program, end to end

SplunkWork+, from 40 trainees to 800+ placed.

The clearest proof a program is a product: when you treat it that way, it improves cohort over cohort, and the design pattern travels.

Year 1 · single cohort. 40 trainees, training-only. No clear path beyond completion. Most didn’t reach placement; the program was treated as an event.
Year 2 · map the journey. Pathway redesigned: recruit → train → certify → place. Each stage assigned a partner, a target conversion, a leading indicator.
Year 3 · cohort comparison. Cohort 2 outperformed Cohort 1 on certification but underperformed on placement. Placement-stage partner was changed.
Year 4 · pattern library. Pathway pattern reused for two adjacent programs. The pathway became a template, not a one-off.
Outcome. 800+ trained. 480 placed. 60% placement rate held across multiple cohorts. The pathway design itself outlasted the team that built it.
When you’d use this

Day-to-day moments where Programs does the work.

Mid-cohort

Catch a problem at week 8.

The leading indicator on mentor engagement slips below threshold. Patricia flags it. You restructure the mentor cadence before the lagging metric reveals a failed cohort.

Quarterly review

Compare cohort to cohort.

Side-by-side: Cohort 1 converted at 43%; Cohort 2 at 50%. The change was the new placement partner. You scale the pattern.

Budget season

Defend the unit economic.

Cost per placement, by program. The CFO asks why the apprentice pathway gets more next year; you have the per-placed dollar comparison ready.

Capabilities

Six things this module gives you that an event calendar doesn’t.

Defined entry points

Who is this for? What does someone need to enter? Made explicit instead of left implicit. Filters quality at the front.

Milestone gates

Each pathway has named milestones learners must hit. Missing a milestone is a signal, not a silent drop-off.

Cohort tracking

Learners move as a cohort with shared start/end. Cohort comparison shows where one group falls behind another.

Conversion funnels

Apply → enrolled → on-track → placed. Drop-offs become design problems, not statistics to bury.

Reusable patterns

Library of pathway templates from real programs: SplunkWork+, Career Pathways, apprentice-to-FTE. Customize, don’t reinvent.

Cost per placement

Total program cost ÷ placements gives the unit economics. Honest comparison across pathway designs.

Module 03 · Governance

Audit-ready governance, without the binder.

Board oversight, executive committee cadence, and a decision log that makes the function defensible at audit. Specialist agents handle the busywork, the structure stays human.

Foundation HQ / Governance
AC

Governance

3 committees · 24 decisions logged Q4 · audit-ready
Export audit log+ Schedule review
CommitteesDecisions logReviews
Board ESG Committee
Active
Last: Mar 12 · Next: Jun 15
JRMKSD+2
Exec ESG Committee
Active
Quarterly · Last: Mar 8
CKACRM
MAR 12 · BOARD ESG
UNCF $2M / 3-yr renewal approved
MAR 08 · EXEC CMTE
EcoVadis 78/100 disclosure approved
Decision agent logs rationale at the moment a call gets made
Audit agent assembles the SOX-ready pack on demand
Disclosure agent generates EcoVadis, GRI, and customer RFP packs
Cadence agent schedules quarterly reviews and prep packs
What this is

Governance is the structure that makes the function defensible.

Most social impact programs fail their first real audit not because the work is bad, but because the work isn’t legible. There’s no committee charter, no decision log, no written rationale, no clear cadence. When a regulator, customer, or new CFO shows up, the team builds the binder from memory the night before.

Patricia’s Governance module is the operating layer that turns the function into something a board can oversee, an auditor can verify, and a customer RFP team can answer. Committees with charters and cadence. A decision log captured at the moment. Audit packs assembled by an agent in minutes, not weeks.

Why this matters to you

  • SOX season won’t collapse a week into your team. The pack is always assembled.
  • Customer RFPs ask for ESG governance. You pull a pack in minutes, not weeks.
  • The board asks “why this decision?” six months after the fact. You have the rationale.
  • Your function looks like a function, not a personality, even when the operator changes.
Two views

Committee structure on one side, the decision log on the other.

Committee · Board ESG
Quarterly · Last meeting Mar 12 · Next Jun 15
JR
MK
SD
+2
Charter
Oversees ESG strategy, approves multi-year commitments, signs off on external disclosures.
Decision rights
Multi-year commitments > $1M, disclosure approval, function structure changes.
Decisions log · Q4
24 logged · export ready for SOX, board, customers
MAR 12 · BOARD ESG
UNCF · $2M / 3-yr renewal
Aligned to Career Pathways multi-year cohort.
MAR 08 · EXEC CMTE
EcoVadis 78/100 approved
+12 pts YoY; supplier governance gains.
The cadence engine

Governance runs on a predictable rhythm.

Annual on the outer ring, quarterly mid-ring, monthly close in. Each committee body has a defined cycle and a defined output.

PatriciaGovernance
AnnualBoard ESG
QuarterlyExec ESG
MonthlyWorking group
WeeklyDecision log

The same cadence every year. The same outputs every cycle.

Annual board review covers strategy and approves multi-year commitments. Quarterly exec committee handles tier changes and disclosure sign-offs. Monthly working group runs cross-functional coordination. The decision log captures everything in between.

The cadence runs itself. Prep packs auto-assemble five days before each meeting. Decisions log the moment they’re made. The function looks like a function, not a personality.

What it produces

Real artifacts the Governance module generates.

Documents an auditor, board member, or regulator can actually open. Generated by agents, not the team at midnight.

Board pack

Q1 2026 Board ESG packet

Auto-assembled · 22 pages · sent 5 days before meeting
Section 1 · Function status
Active programs12
Total commitment$24.7M
Section 2 · Decisions for approval
UNCF 3-yr renewalFor approval
Apprentice expansionFor approval
Section 3 · Risks & flags
2 partners on remediationWatch
For: BoardPDF
SOX evidence pack

Annual SOX 404 walk-through evidence

For internal audit · cited from decision log
Control narrative
ESG decision controls3
Approval matrixDocumented
Sample evidence
UNCF approval · minutesLinked
EcoVadis sign-off · minutesLinked
Auditor walk-through
ScheduleApr 22
For: Internal AuditPDF
Decision log export

Decisions log · Q1 2026

Filterable · cite-able by date, body, or topic
Mar 12 · Board ESG
UNCF 3-yr renewalApproved
Mar 08 · Exec ESG
EcoVadis disclosureApproved
Feb 24 · WG
Apprentice UK + DEApproved
Feb 11 · Exec ESG
SB 253/261 workflowAdopted
For: MultiplePDF · CSV
When you’d use this

Day-to-day moments where Governance does the work.

Pre-board

Pack auto-assembled.

Five days before the board meeting, the pack lands in your inbox. You review, edit the cover memo, send.

SOX walk-through

Auditor on-site.

The auditor asks for evidence on six controls. You pull packs in five minutes. The walk-through finishes early.

Customer RFP arrives

Procurement asks ESG questions.

Sales forwards the customer’s ESG questionnaire. You generate the pack, customize 4 fields, send back. Days, not weeks.

Capabilities

Six things this module gives you that a shared drive doesn’t.

Governance structure

Board, exec committee, working group, each with charter, cadence, members, decision rights.

Decision log

Every committee decision logged with rationale at the moment. Audit-ready exports.

Disclosure pipeline

EcoVadis, SB 253/261, GRI, customer RFPs all generated from one source. Consistent narrative.

7-function coordination

Every function ESG touches has a named owner, intersection point, shared cadence.

Cadence engine

The system runs on a defined annual + quarterly + monthly cadence. Predictable for the board.

Audit-ready posture

External reviewers find a coherent function with documentation, not a binder assembled the week before.

Module 04 · Reporting

One source of truth, every external audience.

EcoVadis, SB 253/261, GRI, customer RFPs, all generated from the same evidence inventory. Stop rebuilding the same disclosure for every requester.

patricia.ai/reporting
Foundation HQ / Disclosure dashboard
AC

Disclosure dashboard

14 RFP packs this Q · audit-ready · one source
Schedule+ Generate
EcoVadis
Ready
78/100
↑ +12 YoY
SB 253/261
Ready
CA-compliant
Ahead of deadline
GRI
Aligned
Universal
Auto-generated
Customer RFP
3 active
14
packs this Q
Reports ready
EcoVadis 2026
Submitted · 78 / 100
Cisco RFP
Generated · 6 sections
SB 253 review
Awaiting approval
What this is

External reporting is the same data, different formats.

Most ESG teams rebuild the same disclosure five different times: once for EcoVadis, once for the new California climate rules, once for GRI, once for the customer RFP that landed Tuesday, once for the board pack. Same numbers, different formats, different deadlines, different overnight crunches.

Patricia’s Reporting module is the layer that turns one inventory of evidence into many disclosures. The data is captured once, in the platform, as part of normal operating cadence. The disclosure pack is generated when needed.

Why this matters to you

  • SB 253/261 enforces in CA. You can’t miss the inventory deadline.
  • EcoVadis is now table stakes for procurement-led customers.
  • Customer RFPs ask ESG questions weekly. Sales loses deals when answers take three weeks.
  • The board needs a clean rollup. Auditors need a verifiable trail. Same data, served right.
From inputs to outputs

One inventory of evidence. Every external audience served.

Inputs
P
Partnerships data
P
Programs outcomes
G
Governance log
M
Measurement indicators
F
Finance & spend
Patricia
Reporting
Outputs
E
EcoVadis pack
S
SB 253/261 disclosure
G
GRI standards
R
Customer RFPs
B
Board pack

Always current

Reports pull live from the platform. No more snapshots that go stale the moment they’re generated.

Audit-traceable

Every line item ties back to a source decision, indicator, or program. Reviewers can drill into the evidence.

Alerted, not surprised

Push alerts when a customer RFP arrives or a disclosure deadline gets close, never another all-nighter.

Frameworks supported

Three frameworks, one underlying inventory.

Each disclosure framework demands a different format. Patricia handles the format. The data underneath stays the same.

EcoVadisAnnual
Procurement-led customer scorecard. Supplier-driven evaluation across four themes.
CycleAnnual
Themes4
Latest score78 / 100
YoY change↑ +12 pts
SB 253/261CA law
California climate disclosure. Scope 1/2/3 emissions plus climate-risk reporting.
CycleAnnual
CoverageScope 1/2/3
StatusInventory ready
PostureAhead of deadline
GRI & RFPsOn demand
GRI Universal alignment plus customer RFP packs auto-generated from the same source.
GRI alignmentUniversal
RFP packs Q114
Avg turnaround2 days
AuditableVersioned
What it produces

Three packs from one inventory.

Same data, different audiences. Each pack tailored to what the audience actually needs.

EcoVadis disclosure

EcoVadis 2026 submission

Submitted Mar 22 · 78 / 100 score · +12 YoY
Score by theme
Environment72 / 100
Labor & HR82 / 100
Ethics78 / 100
Sustainable proc.80 / 100
Year-over-year drivers
Supplier governance+8 pts
Emissions tracking+4 pts
For: Procurement-led customersPDF
SB 253/261 disclosure

California climate disclosure 2026

CA-compliant · ahead of enforcement · auditor-ready
Scope 1 emissions
Direct fuel use1,240 tCO2e
Scope 2
Purchased electricity3,890 tCO2e
Scope 3 (key)
Business travel820 tCO2e
Purchased goods14,500 tCO2e
Climate risk · SB 261
Physical riskDocumented
Transition riskDocumented
For: CA Air Resources BoardPDF
Customer RFP pack

Cisco enterprise RFP · ESG section

Generated Mar 18 · from RFP template · reviewed by sales + ESG
Section 1 · Governance
Board ESG oversightDocumented
Section 2 · Disclosure
EcoVadis78 / 100
GRI alignmentUniversal
Section 3 · Workforce
Pathways outcomes480 placed
Section 4 · Suppliers
Code of conductLive
For: Sales / CiscoDOCX
When you’d use this

Day-to-day moments where Reporting does the work.

EcoVadis cycle

Annual disclosure submission.

The EcoVadis cycle opens. Patricia generates the draft using your year of operating data. Two days of human review, not two weeks of assembly.

Customer RFP

Sales forwards a 60-question RFP.

You generate the ESG sections from the customer-RFP template, customize the framing, send back. Sales doesn’t lose the deal to assembly time.

Board pack

Quarterly board update.

The board gets the same data the auditors get and the same data customers get, framed for their level. One source, three audiences.

Capabilities

Six things this module gives you that a folder of PDFs doesn’t.

Always-current dashboard

EcoVadis score, CA compliance posture, GRI alignment, live, not snapshot.

One inventory, many packs

The same source data generates EcoVadis, GRI, SB 253/261, and customer RFPs. No duplicate work.

Deadline alerts

EcoVadis cycle opening, SB 253 inventory due, customer RFP arrived, surfaced before they’re late.

Auditor traceability

Every line item ties to a source decision, indicator, or program. Reviewers can drill in.

Versioned packs

Last year’s submission is preserved. The auditor can ask “what did you tell them?” and you can show them.

Multi-audience framing

Same numbers, different framing for the board, the auditor, the customer, the regulator.

Module 05 · Templates

Operating-model patterns, drawn from real impact functions.

Don’t reinvent the partnership agreement. Don’t reinvent the cohort funnel. The Templates library captures patterns from Salesforce, Splunk, PlayStation, Proofpoint, ready to customize for your context.

All Partnerships Programs Governance Reporting
Governance charter
Used 14x
Cohort funnel
Used 18x
EcoVadis Q response pack
78+ avg score
Renewal review
31x · top used
Quarterly board pack
Used 12x
What this is

A template is an operating pattern, not a Word doc.

Most “template libraries” are folders of stale documents nobody updates. Patricia’s templates are different: they’re patterns extracted from real impact functions that actually shipped, paired with usage data showing what works.

The multi-year partnership agreement template carries the structure that worked at Salesforce. The cohort funnel template carries the SplunkWork+ stage design. The board pack template carries the governance pattern from PlayStation. You don’t inherit a blank document, you inherit a working operating model.

Why this matters to you

  • The first 90 days don’t get spent reinventing the partnership template.
  • You can see which templates other operators use most, usage is a signal of what works.
  • Customizing a working pattern beats copying a stranger’s blog template.
  • Patricia auto-fills variables from your platform, partner names, terms, programs, so the template lands almost-done.
Apply a template

Customize, not reinvent. The template fills your data in.

Pick a pattern. Patricia pre-populates from your platform. Edit what’s contextual, ship.

Library / Multi-year partnership agreement
AC

Multi-year partnership agreement

Pattern · used 23x · Salesforce, Splunk, PlayStation
PreviewApply to UNCF
SectionsVariablesUsed in
Sections
1. Parties & entity references
2. Scope & programs covered
3. Term & renewal mechanics
4. Reporting & review cadence
5. Governance & escalation
6. Termination & transition
Auto-filled from platform
PartnerUNCF
TierAnchor
Term3-yr · Apr 26-29
ProgramsCareer Pathways
Anatomy of a template

Four parts that make a template more than a Word doc.

A Patricia template carries the structural pattern, the variables, the auto-fill rules, and the usage signal. It’s an operating model, not a stale boilerplate.

A

Sections

The structural skeleton. Sections that worked when the template was lifted from a real partnership at Salesforce, Splunk, or PlayStation.

B

Variables

Defined placeholders for the contextual parts, partner name, term, dollar commitment, geographies. Editable per use.

C

Auto-fill rules

Patricia knows where each variable lives in the platform. Pick “UNCF” and the partner-tier, term, and program list pre-populate.

D

Usage signal

Every application of the template feeds back to the library. The most-used templates rise to the top, usage tells you what works.

Multi-year agreement
A · Sections
1. Parties · 2. Scope · 3. Term · 4. Reporting · 5. Termination
B · Variables · C · Auto-fill
PartnerUNCF
TierAnchor
Term3-yr
D · Usage
Used 23xSalesforce, Splunk
What it produces

Three real artifacts produced from a template.

Same patterns, applied to your context, ready to send.

Partnership agreement

UNCF · multi-year MoU draft

From the multi-year partnership agreement template · auto-filled, ready for legal
Section 1 · Parties
PartnerUNCF
Section 2 · Scope
ProgramsCareer Pathways
Section 3 · Term
Term3-yr / 2026-29
Total$2.0M
Section 4 · Cadence
ReviewsQuarterly
For: Legal reviewDOCX
Cohort funnel template

Apprentice cohort · pathway design

From the SplunkWork+ pattern · adapted for new program
Stage 1
RecruitPer Scholas
Stage 2
TrainYear Up
Stage 3
Mid-term gateMentor sign-off
Stage 4
Place · FTEInternal
For: Program teamDOCX
Quarterly board pack

Board ESG · Q1 2026 pack

From the quarterly board pack template · data auto-filled
Section 1 · Function status
Active partnerships47
Total commitment$24.7M
Section 2 · For approval
UNCF 3-yr renewalFor approval
Section 3 · Risks
Apprentice mentor cadenceWatch
Section 4 · Q ahead
UK + DE expansionQ3 launch
For: Board ESGPDF
Pulled from real operating models

Patterns built from work that actually shipped.

Salesforce Splunk PlayStation Proofpoint Box Twilio
When you’d use this

Day-to-day moments where Templates does the work.

New partner intake

You don’t draft from scratch.

The multi-year partnership agreement template loads, auto-fills with the partner’s tier and term, lands in your editor 80% done.

Quarterly review

Board pack pre-drafted.

The board pack template runs against the past quarter’s decisions, partnerships, and indicators. You spend the prep time on framing, not assembly.

New program design

Pick a working funnel.

Don’t guess at stage design. Pick the SplunkWork+ pattern. Adapt the partners and entry criteria. Ship something that worked, customized.

Capabilities

Six things this module gives you that a template folder doesn’t.

Operating-model patterns

Not Word docs, structured patterns that capture how the work actually runs.

Auto-fill from platform

Partner, term, program, indicators, all variables pre-populated from your operating data.

Usage data

See which templates other operators use most. Usage is a signal of what works.

Drawn from real work

Patterns from Salesforce, Splunk, PlayStation, Proofpoint, functions that actually shipped.

Customizable, not rigid

Structural parts stay. Contextual parts edit. The team focuses on what’s unique, not on the structure.

Living library

Templates evolve as the operating model evolves. The newest version is always the best version.

Module 06 · Continuity

Functions that survive operator transitions.

When the operator leaves, the function shouldn’t restart. Continuity captures decisions, partnerships, and obligations as institutional knowledge, ready for the next person on day one.

Foundation HQ / Continuity

Decision timeline

Why we made the calls we made · ready for the next operator
MAR 2026
UNCF moved to 3-yr commitment
Aligns with multi-year cohort design.
FEB 2026
Adopted SB 253/261 workflow
CA-compliant ahead of enforcement.
DEC 2025
Apprentice Pathway expansion
Q3 pilot validated 50% conversion.
Successor pack
Generated for next operator
Anchor relationships
UNCF · Dr. M. Lomax
Per Scholas · P. Ortiz
Open governance
Board ESG · Jun 15
What this is

Continuity is institutional memory made operational.

Most social impact functions live in the head of one or two operators. When those operators leave, the function effectively restarts: anchor relationships drift, past decisions get re-litigated because no one captured the rationale, and the work that took years to build looks fresh to the board because the new person can’t cite what came before.

Patricia’s Continuity module captures the why behind every meaningful decision, the touch history of every anchor relationship, and the open obligations the function carries. The successor inherits judgment, not a blank slate.

Why this matters to you

  • Average impact-team tenure is 18-24 months. The function should outlast it.
  • Every reorg risks restarting the work. Continuity is the firewall.
  • The board hates seeing the same idea pitched twice. Continuity prevents it.
  • Anchor partners notice when their relationship gets dropped. Continuity holds it.
The timeline

Every decision, captured at the moment.

Decisions logged with rationale the day they happen, not reconstructed from memory at handoff.

Mar 2026 · Anchor renewal

UNCF moved from 1-yr to 3-yr commitment

Aligns multi-year scholarship structure with Career Pathways cohort design. Reduces renewal cycle overhead.

Decision · Mar 12
Approved $2M / 3-yr renewal at Board ESG Cmte. Rationale: align with multi-year cohort.
Feb 2026 · Compliance

SB 253/261 reporting workflow adopted

Internal emissions inventory + climate-risk template ahead of CA enforcement. EcoVadis improvement secondary benefit.

Workflow approved
Sustainability + Legal + Finance signed off. Inventory ready Q1.
Dec 2025 · Program expansion

Apprentice Pathway → UK + Germany

Q3 pilot validated 50% conversion rate. Scaling to 2 new geographies before broader rollout.

Expansion green-lit
UK + DE pilots Q1. Per Scholas + Year Up partner roles defined.
How memory transfers

Three things a function has to remember to survive its operator.

What was decided, and why

Anchor renewals, tier changes, scope expansions, strategic pivots, the decisions that move money or reshape the function. Patricia captures each one the day it’s made, with the rationale beside the call. Six months later when an exec asks “why did we double down on UNCF?”, the answer doesn’t come from someone’s memory. It comes from the log.

Who you trust, and why

Anchor relationships are built across years of touchpoints, conversations, escalations, course corrections. The relationship context lives on the partner record: the executive director’s preferred cadence, the time we navigated a budget cut together, the program lead’s judgment on a difficult call. The next operator inherits the relationship, not just the email address.

What’s in flight

Multi-year commitments mid-cycle. Customer RFPs in the queue. Regulatory deadlines on the calendar. Patricia keeps a live obligations register so the successor walks in knowing what’s due, when, and to whom. There’s no “wait, the apprentice expansion is up for approval next month?” surprise on day three.

What it produces

Three artifacts that make the function transferable.

Generated on demand, for transitions, board reviews, or just so the team can reread its own logic.

Successor handoff pack

Successor pack · impact function

Generated when operator transitions · ready in 2 minutes
Anchor relationships
UNCF · Dr. M. Lomax9 yrs
Per Scholas · P. Ortiz5 yrs
NetHope · L. Costello11 yrs
Active commitments
$24.7M committed12 programs
$8.2M renewingthis Q
Open governance
Board ESG reviewJun 15
Apprentice expansion approvalApr 8
For: New operatorDOCX
Decision archive

3-year decision archive

All meaningful calls · with rationale · cite-able by topic, body, or year
2026 highlights
UNCF 3-yr renewalMar
SB 253 workflowFeb
2025 highlights
Apprentice expansionDec
CRM migrationOct
2024 highlights
Function structureSet
Tiered partner modelAdopted
For: Board / audit / new operatorPDF
Methodology archive

Operating-model archive

How the function actually runs · written down once, used by every successor
Function structure
Committees · charters3
7-function mapOwners named
Cadence
AnnualBoard review
QuarterlyExec ESG
MonthlyWorking group
Patterns in use
Templates referenced23
For: SuccessorDOCX
Before / after

When the operator leaves, the function doesn’t restart.

Without continuity

The function restarts every time leadership changes.

  • Anchor relationships drift, partner contact changes, no successor knows their history.
  • Past decisions get re-litigated because the rationale wasn’t captured.
  • The function looks reset to the board even though the work has been continuous.
With Patricia continuity

The successor inherits judgment, not just data.

  • Anchor relationships handed off with touchpoint history, decision context, open commitments.
  • Decision timeline preserves the why, the next operator skips months of re-discovery.
  • The function reads as continuous to the board, regulators, and partners, because it is.
When you’d use this

Day-to-day moments where Continuity does the work.

Operator transition

New person, day one.

The successor pack lands in the new operator’s inbox before they start. By Friday they’ve had context on every anchor partner.

Reorg under new exec

The function survives.

The new exec asks “why this partner?”, “why this commitment?”. The decision archive answers without anyone reconstructing from memory.

Board challenge

“Didn’t we already try this?”

Yes, three years ago. Here’s what we tried, here’s why it didn’t work, here’s what changed. Cited from the archive.

Capabilities

Six things this module gives you that a wiki doesn’t.

Decision timeline

Every meaningful call captured with rationale at the moment, not reconstructed from memory.

Successor handoff pack

Generated on demand: anchor briefs, open obligations, decision archive, methodology archive.

Anchor relationship context

Touch history, decision context, escalation paths, attached to the partnership.

Open obligations register

Multi-year commitments, regulatory deadlines, governance items mid-flight, one source.

Methodology archive

How the function runs, written down once. The pattern survives the operator.

Onboarding for next operator

The successor inherits judgment, not a blank slate. Day one is a real day one.

For Recruiters & Hiring Managers

A faster way to assess fit.

This page is here to save you time. It explains the kinds of roles I fit best, where I add value, how I work, and what would help us have a great early conversation.

At a glance Available
Looking for
Senior practitioner · broad mandate
Location
SF Bay Area · open to relocation
Work mode
In-office preferred · all modes open
Availability
Available now, being intentional
I'm here as a…
For Recruiters

Quick Fit

Six fast answers to the questions recruiters scan for first.

What I do
Build social impact as an operating function inside the business. Strategy, governance, and execution as one system.
Best-fit roles
Senior practitioner roles where strategy and execution combine. Titles vary by org. The work is what I optimize for.
Best-fit scope
Broad mandates with real authority. Multiple workstreams, named sponsorship, cross-functional reach.
Less ideal fit
Reporting-only, fundraising-led, narrative-first, or single-program specialist roles. Those are real crafts in their own right, just a different lane from mine.
Location
SF Bay Area. Open to relocation for the right mandate.
Work mode
In-office preferred. Hybrid and remote open if the role calls for it.
Comp
Targeting senior practitioner base and equity in line with SF Bay Area market. Open to discuss. Total package and scope is what I optimize for, not title alone.
Availability
Available now and being intentional about the next move. Open to talk about strong-fit roles, and can move on a 2 to 3 week timeline once the right one is in view.
For Recruiters

Scope Over Title

Titles in this field are noisy. The same role gets posted as Specialist, Manager, Director, or VP depending on the org and the recruiter. The actual work usually looks the same.

Honestly, if I'm here, I want the role and I'm all in on the work. The four levels overlap more than the titles suggest, and chances are I'm already doing most of it in the same week. Have a look at any level below to see what I mean.

Where I actually operate All four levels · same person, same week, every week. Title is the label, not the work.
Specialist
Manager
Director / Sr. Dir
VP / Head / Exec
In a typical week
Specialist
Pressure-test the impact metric we reported to the board against how the partner actually measures it. Sit with the analyst, redo the math together, and rebuild the slide before the next executive committee. Always happy to be hands-on with the team when the answer needs to be airtight.
Manager
Run the cross-functional partner review with HR, Brand, and Legal. Help unblock the data-sharing decision that has been stuck in committee for three weeks, and get the program back on schedule with the team.
Director
Partner with the team to design how partnership decisions escalate from program teams to executive sponsors. Set the threshold for what gets a board view versus what is run inside the function.
Executive
Brief the CFO on the operating-cost vs. impact-yield tradeoff across the partnership portfolio. Bring forward portfolio recommendations and walk the board through the reasoning.
For Recruiters

Common Questions

The questions I get most often from recruiters and talent partners. Happy to dig in further on any of these.

Are you open on title?+

Yes, very open. I care more about scope and the team than the title. Happy to let the title follow the work.

What is the fastest way for you to know if a role is a fit?+

Three signals usually do it: scope, sponsor, and whether the work sits as a real function rather than a side initiative. Send the JD, give me 20 minutes, and I can usually get to a clean yes or no.

What is your timeline and availability?+

Available now and being intentional about the next move. Open to interview on a tight cadence, and I can move on a 2 to 3 week timeline once we both know it's a strong fit. Happy to work with you to make the process easy on everyone involved.

Are you open to relocation or different work modes?+

Based in the SF Bay Area, with relocation open for the right mandate. In-office is my preference, and I am open to hybrid or remote when the role calls for it.

Why are you looking now?+

I'm being patient. Fifteen years in, I know what makes this work go well: a sponsor who actually wants the function, a real budget instead of a comms line item, and a CFO who reads the disclosures. The category is changing fast right now, and I'd rather wait for the right seat than take a wrong one.

What kind of company stage are you best for?+

All of them, in different ways. I've worked across small and large, and each stage has its own version of the work that makes it interesting. Early, you're building before anyone tells you what to build. Mid-stage, you're scaling without losing the discipline that made it work in the first place. Enterprise, you're maturing the whole thing into something audit-proof. Each one teaches you something different. What I care about more is whether the role is real, not what size the company is.

What's your compensation philosophy?+

Market for a senior practitioner role in the Bay Area, and I'll share specific numbers on a call once we're aligned on the role. A few things I weight more than top-of-band: base, because impact functions tend to get cut first when budgets tighten; equity, if there's a real growth story to point to; and the actual scope under the title. I'd take a smaller package for a real seat over a bigger one for a title with nothing underneath it.

Are you talking to other companies right now?+

Possibly. I'm being intentional about where I spend interview cycles. If we get to a real conversation, I'll be transparent about timing, other processes I'm in, and where you stand.

How do you feel about AI's impact on this work?+

AI is changing the operating layer of this work: governance, reporting, partnership analytics, audit workflows. I've been building inside it, not just thinking about it. Patricia is the most visible example. The case study you'd ask me about most.

My read on where this is going: the senior practitioner of the next five years manages a small set of agents, not a 20-person team. When one IC with real operational rigor can run what used to take a department, the role shifts. The leaders who can execute the actual work at IC depth, not just oversee it, are the ones who'll matter.

That's the lane I've built toward. Operational rigor and execution at the IC level, with AI as the leverage layer underneath. It's where I'm strongest, and I think it's where the work is heading.

What other titles or lanes could fit you?+

More than people might assume. The muscle I've built (cross-functional orchestration, operating-layer architecture, governance pipelines, multi-year program execution) transfers cleanly outside the social impact lane. Five that fit:

Chief of Staff is the most natural. Fifteen years working across the C-suite, translating executive strategy into operational execution and managing cross-functional dependencies. That's the job description.

Head of Business Operations / BizOps is the same muscle, different framing. Building the operating system for a function (owner maps, evidence pipelines, audit-readiness, scaled cadence) is exactly the work I do. The category is "impact" today, but the underlying discipline is operational.

Head of Strategy & Operations translates well too. The bridge between executive vision and operational reality is what I've been doing inside a specific function for fifteen years. The skill set carries across.

Strategic Partnerships is in the bone of my work. Anchor nonprofit relationships, multi-year stewardship, coalition design with peer companies, partner-to-customer pipelines. The architecture is the same whether the partner is a nonprofit or a commercial counterpart.

Government & Community Affairs sits one step out from where I already operate. Multi-stakeholder engagement, disclosure readiness, board-level reporting, community investment strategy. At many companies, social impact lives inside this broader function. Same operating discipline, broader portfolio.

Tool 01 · Partnership Scorecard

Move partnership decisions from intuition to evidence.

Most cross-sector partnerships get evaluated by gut feel: does the leader like them, do they show up to the right galas, do they have a logo we recognize? The Partnership Scorecard replaces that with a structured evaluation across strategic fit, execution capability, and risk, so the partner portfolio reflects strategy, not history.

Built from 47 partner relationships, $24.7M in commitments Grounded in Salesforce, Splunk, PlayStation operating models
Partner scoring · 3-dimension evaluation
Per Scholas
93
UNCF
90
NetHope
86
Year Up
76
NPower
72
Black Girls CODE
68
Gameheads
56
Anchor (80+) · Program (60-79) · Community (<60)
Why this exists

Partnerships are the highest-leverage and highest-risk part of the portfolio.

Partnerships move millions of dollars and shape multi-year programs. Evaluated by intuition, the same big-name partners get re-funded out of inertia while smaller partners with stronger execution get overlooked. The Scorecard forces a clear answer to one question: what role does this partner play in the strategy, and how well are they playing it?

Strategic fit

How tightly the partner’s mission, geography, and population served align with the company’s strategic objectives. Scored on three sub-criteria.

Execution capability

Track record on outcomes, financial transparency, organizational maturity, and ability to deliver at the scale the program needs.

Risk profile

Reputational, governance, financial, and execution risk, the things that can go wrong, scored honestly so escalation paths are clear.

Tier assignment

Score determines tier, Anchor (multi-year, anchor commitment), Program (focused, annual), Community (smaller, scoped), with explicit playbooks for each.

Renewal cadence

Re-score annually for Program tier, every two years for Anchor. Scores changing over time become a signal, not a yearly surprise.

Defensible at audit

Every score has a written rationale. Procurement, legal, and finance reviewers can see why a partner sits in a tier and what changed since last cycle.

How it works

Five steps from intake to active management.

Define the strategic role you’re filling

Before scoring, the team writes what role this partner is meant to play in the portfolio: anchor for a multi-year scholarship pipeline, regional execution partner, technical specialist, etc. Scoring without this becomes a beauty contest.

Score against the criteria, with rationale

Each dimension scored 0-100, with a written reason. No score without reason. The reason is the audit trail.

Tier assignment and playbook

Total score maps to a tier. Each tier has a defined playbook for how the relationship runs, meeting cadence, decision authority, reporting, escalation paths.

Active management on cadence

Anchor partners reviewed quarterly with the executive committee. Program partners reviewed at renewal. Community partners reviewed annually in a single batch session.

Re-score and re-tier

The most important step: scores change. Partners that have outgrown their tier get promoted. Partners drifting downward get a remediation plan or a graceful exit. The portfolio reflects current reality.

Real scenario

How a 47-partner portfolio gets evaluated and reset in one quarter.

This is roughly how the Partnership Scorecard plays out across one quarterly review cycle, drawn from real review patterns at PlayStation and Splunk.

Week 1

Score refresh

Each partner manager updates their partner’s scores with rationale notes, flagging anything that’s shifted in the last cycle.

Week 2

Tier review

Six partners now sit at the boundary between tiers. Three are candidates for promotion to Anchor; three are flagged for downgrade.

Week 3

Exec committee

The Anchor candidates are presented with three years of execution data; two get approved for multi-year commitments.

Week 4

Remediation plans

Two downgrade candidates get 90-day remediation plans. One gets a graceful 12-month wind-down.

Outcome

Portfolio reset

The 47-partner portfolio now reflects current reality, with budget shifted to higher-leverage partners and clear paths for the others.

How it connects

The Scorecard feeds the rest of the platform.

Tier assignment isn’t just a label, it changes how every other tool treats that partner.

Pathways Builder

Anchor partners run anchor pathways

Multi-year cohort pipelines pair with Anchor-tier partners. Their tier earns them long-horizon programs.

Strategy Mapper

Tier ties to strategic outcome

Each tier maps to specific outcomes. Anchor partners own outcomes; Community partners contribute to them.

ESG OS

Decisions logged at audit grade

Every tier change and renewal flows through the decision log. Score rationale becomes part of the audit trail.

Measurement

Score thresholds become indicators

Drops below tier threshold become a leading indicator that triggers an early conversation, not a year-end surprise.

Run the rest of the platform.

The Partnership Scorecard works alone, but the platform is more powerful together. Each tool sharpens the others.

Tool 02 · Workforce Pathways Builder

Treat career pathways as products, not events.

Most workforce programs run as a calendar of activities, trainings, events, panels, with no clear journey from a learner’s entry point to a defined outcome. The Pathways Builder treats every program as a product: defined entry, milestones, drop-off points, and outcomes you can measure.

Built from SplunkWork+, Career Pathways, Mayor Lee STEM Tracks 800+ trained, 480 placed, 50% apprentice conversion
Apprentice → FTE pathway funnel
Apply
220
Enrolled
56
Mid-term
52
Internship
18
Placed
9
Conversion: 4% · Cost / placement: $30K · Time-to-FTE: 14 mo
Why this exists

Workforce programs fail when no one defines the journey.

Run as a calendar of activities, workforce programs can’t answer basic questions: how many learners enter, how many drop off where, how many complete, how many actually get placed. The Pathways Builder makes the journey explicit so it can be designed, measured, and improved over time.

Defined entry points

Who is this for? What does someone need to enter? Made explicit instead of left implicit. Filters quality at the front.

Milestone gates

Each pathway has named milestones learners must hit. Missing a milestone is a signal, not a silent drop-off.

Cohort tracking

Learners move as a cohort with shared start/end. Cohort comparison shows where one group falls behind another.

Conversion funnels

Apply → enrolled → on-track → placed. Drop-offs become design problems, not statistics to bury.

Reusable patterns

Library of pathway templates from real programs: SplunkWork+, Career Pathways, apprentice-to-FTE. Customize, don’t reinvent.

Cost per placement

Total program cost ÷ placements gives the unit economics. Honest comparison across pathway designs.

How it works

Five steps from blank page to running pathway.

Define the outcome and the population

Who is this pathway for, and what counts as success? “Place 30 entry-level engineers from underrepresented backgrounds” is testable. “Increase opportunity” is not.

Map the journey from entry to outcome

Identify the actual stages a learner moves through. Where are the gates? What makes someone ready for the next stage?

Pick partners for each stage

One partner rarely owns the whole journey. Identify which partner is best for each stage, recruitment, training, placement, retention support.

Set milestone-level metrics

Conversion rate at each stage. Cohort size. Cost per learner at that stage. Without per-stage metrics, you only see the final number, too late.

Run a cohort, then iterate

Each cohort is a learning cycle. What converted better? What broke? Pathway design improves quarter over quarter, not in big-bang relaunches.

Real scenario

How SplunkWork+ evolved from a single program into a multi-cohort pipeline.

Drawn from the SplunkWork+ workforce pipeline (2017-2021), training 800+ veterans and transitioning talent in cybersecurity careers.

Year 1

Single cohort

40 trainees, training-only. No clear path beyond completion. Most didn’t reach placement; pathway was treated as an event.

Year 2

Map the journey

Pathway redesigned: recruit → train → certify → place. Each stage assigned a partner, a target conversion, and a leading indicator.

Year 3

Cohort comparison

Cohort 2 outperformed Cohort 1 on certification but underperformed on placement. The placement-stage partner was changed.

Year 4

Pattern library

Pathway pattern reused for two adjacent programs. The pathway became a template, not a one-off.

Outcome

800+ trained, 480 placed

60% placement rate held across multiple cohorts. The pathway design itself outlasted the team that built it.

How it connects

The Pathways Builder connects to the rest of the platform.

Scorecard

Pathways pair with tiered partners

Anchor pathways pair with Anchor partners. Tier assignment dictates the pathway depth.

Strategy Mapper

Pathway outcomes map to strategy

Each pathway is one of the named outcomes in the strategy map. Activity and strategy stay aligned.

Measurement

Funnel stages are leading indicators

Stage conversion rates serve as leading indicators in the measurement framework. You see drop-offs in real time.

Engagement

Mentor and pro-bono hooks

Employee mentor programs map to specific stages of the pathway, not generic volunteering.

Run the rest of the platform.

The Pathways Builder works alone, but it’s far more powerful when wired into Strategy, Measurement, and Engagement.

Tool 03 · Impact Strategy Mapper

Connect executive strategy to community impact.

Most impact programs operate in a layer separate from the company’s actual strategy. Leadership describes the company’s direction, the impact team describes its programs, and the connection between the two is implied. The Strategy Mapper makes the connection explicit: business objective → intended community outcome → the indicators that prove it’s working.

Bridges exec strategy ↔ impact program design Built from ESG operating models at PlayStation, Proofpoint
Talent pipeline objective · mapped
OBJECTIVE
Build a diverse talent pipeline aligned to product roadmap
OUTCOME
Pipeline-ready talent in target geographies
INDICATORS
Apprentice conversion · placement rate · 24-mo retention
Why this exists

The strategy ↔ impact gap is where credibility dies.

When the impact team can’t answer “how does this connect to what the company is trying to do?”, the work gets cut in the next budget cycle. The Strategy Mapper closes that gap by forcing every impact program to trace back to a stated objective and forward to measurable outcomes.

Strategic objective layer

The top layer of the map. Each objective is sourced from the actual exec strategy, not invented in the impact team.

Outcome layer

Community-level outcomes the company is trying to influence. Distinct from outputs, outcomes are about change, not activity.

Indicator layer

Both leading (early signals) and lagging (proven outcomes). Each indicator is owned, defined, and tracked at a stated cadence.

Visible connections

The map shows how every program ladders to a strategic objective. Orphan programs become obvious and get either re-anchored or cut.

Stakeholder alignment

The same map serves the board, the executive team, the impact team, and external partners, one shared view of strategy → impact.

Defensible at budget time

The map is the evidence. Cuts are debated against strategic outcomes, not against vibes about which program seems important.

How it works

Five steps from boardroom strategy to ground-level indicator.

Pull objectives from real exec strategy

Read the actual board materials, OKRs, and shareholder communications. Pull the 5-7 strategic objectives that the company is committed to. Don’t invent.

For each objective, name the community outcome

If we succeed at this objective, what changes for the communities we work with? Specific, named outcomes, not platitudes.

Define leading and lagging indicators

Two tiers: early signals (weekly/monthly) and proven outcomes (quarterly/yearly). Both required, one alone is incomplete.

Connect every program to the map

Map each existing program to the layer it belongs to. Programs that don’t connect get re-anchored or sunset.

Re-walk the map every quarter

Strategy shifts; outcomes update; indicators get refined. The map is a living artifact, not a poster.

Real scenario

From orphan programs to strategy-aligned portfolio.

Drawn from the ESG strategy work at Proofpoint where 14 active programs had no clear connection to the company’s growth strategy.

Audit

14 programs, no map

Each program had a sponsor and a budget, but no clear answer to “why this” that connected to the company’s strategy.

Map

Pull objectives

Five exec objectives sourced from board materials. Three of them had clear community-level connections; two didn’t.

Connect

Programs → outcomes

Of 14 programs, 9 mapped cleanly. 3 had partial maps and got reframed. 2 didn’t map and were sunset.

Indicators

Add measurement

Each remaining program now has both a leading and lagging indicator that ties to its outcome. Activity-only metrics removed.

Outcome

Defensible portfolio

Budget review goes faster. Cuts are debated against outcomes; programs that survive earn it on the map.

How it connects

The Strategy Mapper organizes the rest of the platform.

Scorecard

Partners ladder to outcomes

Anchor partners own outcomes; tier assignment is a function of which outcomes they’re anchoring.

Pathways

Pathways are outcomes in motion

Each named pathway is one of the outcomes on the map, activity laddered to strategy.

Measurement

Indicator definitions live here

The map is where leading/lagging indicators are defined; Measurement is where they’re tracked.

ESG OS

Disclosures cite the map

External reporting (EcoVadis, GRI, RFP) cites the strategy map as the basis for the impact narrative.

Run the rest of the platform.

The Strategy Mapper is the connective tissue. It works alone, but it’s most powerful as the spine of the whole platform.

Tool 04 · ESG Operating System

The infrastructure that makes ESG actually function.

Most ESG programs run as a stack of disconnected workstreams: a sustainability initiative here, a DEI committee there, a customer RFP team somewhere else. The ESG Operating System is the governance, reporting, and cross-functional coordination layer that turns those workstreams into a single function the company can operate, defend, and improve.

Built from the Proofpoint ESG OS, the PlayStation 7-function model Outputs EcoVadis, SB 253/261, GRI, customer RFPs, from one source
7-function ESG operating model
Legal & compliance
People & culture
Sustainability
Procurement
Sales / Customer
Communications
Finance / Risk
All seven functions on the same operating cadence.
Why this exists

ESG isn’t a department, it’s an operating model.

ESG touches at least seven functions: legal, people, sustainability, procurement, sales, communications, and finance. Without an operating system, those functions move at different cadences, produce inconsistent disclosures, and miss the connections between them. The ESG OS is the layer that makes those functions a single coordinated practice.

Governance structure

Board ESG committee, executive ESG committee, cross-functional working group, each with charter, cadence, members, decision rights.

Decision log

Every committee decision logged with rationale at the moment it’s made. Audit-ready exports for board, regulators, customers.

Disclosure pipeline

EcoVadis, SB 253/261, GRI, customer RFP packs all generated from one source of truth. Consistent narrative across audiences.

7-function coordination

Every function that touches ESG has a named owner, a defined intersection point, and a shared cadence. No more parallel-track surprises.

Cadence engine

The whole system runs on a defined annual + quarterly + monthly cadence. Predictable for the board, defensible for the auditor.

Audit-ready posture

External reviewers find a coherent function with documentation, not a binder of one-off PDFs assembled the week before.

How it works

Five layers from board to disclosure.

Establish governance bodies and charters

Board ESG committee at the top, executive ESG committee in the middle, working group at the working level. Each gets a charter that defines decision rights and cadence.

Map the seven functions and their intersections

Identify where ESG touches legal, people, sustainability, procurement, sales, communications, and finance. Name the owner and the intersection points.

Stand up the disclosure pipeline

EcoVadis, SB 253/261, GRI, customer RFP, each gets a defined source, owner, cadence, and review path.

Run on cadence

Monthly working group, quarterly executive committee, biannual board committee. Predictable rhythm, predictable outputs.

Audit, refine, repeat

External audit cycle becomes a moment to verify the system, not invent it. Each cycle improves the operating system.

Real scenario

From scattered ESG initiatives to a functional operating system.

Drawn from the Proofpoint ESG OS work (2025-2026), establishing governance, disclosure, and cross-functional coordination from scratch.

Audit

State of play

Three workstreams, no committee structure, no decision log, one customer RFP pack assembled annually under pressure.

Charter

Governance stood up

Board ESG committee, executive ESG committee, and working group chartered. First meetings scheduled with defined cadence.

Functions

7 owners named

Each of the 7 functions gets an ESG point person. Intersection points mapped: where they need to coordinate, when, on what.

Disclosure

Pipeline built

EcoVadis, SB 253/261, GRI, customer RFP, each on a defined cadence, sourced from one inventory of evidence.

Outcome

Audit-ready

EcoVadis score +12 pts YoY. External auditor finds a coherent function. RFP teams pull packs in days, not weeks.

How it connects

The ESG OS is the spine the platform rests on.

Scorecard

Tier changes flow through governance

Tier promotions and demotions become decisions in the log; partner work is treated like any other governed activity.

Strategy Mapper

Disclosures cite the map

The map is the source narrative behind every external disclosure. The story stays consistent across audiences.

Measurement

Indicators feed disclosure

Lagging indicators are most of what gets reported externally. Disclosure quality is measurement quality.

Engagement

Volunteering becomes a workforce signal

Employee participation is a credible piece of the ESG narrative when it ties to outcomes, not just hours.

Run the rest of the platform.

The ESG OS is the operating layer. The other tools sit on top of it and feed into it, together, they make the function defensible and useful.

Tool 05 · Measurement Framework

Define success and failure before you start.

Most impact programs measure activity (events run, people reached) and call it evaluation. The Measurement Framework forces the harder, more honest version: name what counts as success, name what counts as failure, define leading and lagging indicators, and let the program tell you when it’s working, or when it’s not.

Tracks 110 indicators across leading + lagging Built from measurement work at Splunk, Proofpoint, PlayStation
Apprentice pathway · indicator panel
LEADING (weekly)
Attendance > 90%
on
Mid-term ≥ 4.2/5
on
Mentor weekly
flag
LAGGING (yearly)
FTE conversion 50%
on
24-mo retention 70%
watch
Wage gain +$25K
on
Why this exists

Vanity measurement is the silent killer of impact work.

Activity metrics are easy and feel productive: how many trained, how many events, how many hours. But they don’t tell you whether the program is working. The Measurement Framework requires defining outcomes before the program starts, with both early signals and proven results.

Pre-defined success

Before starting, write what success looks like quantitatively. “Place 30 engineers from underrepresented groups, 70% retained at 24 months.” Specific, testable.

Pre-defined failure

Equally important. Write the threshold below which the program is failing. Failure is not “less success”, it’s a defined condition that triggers escalation.

Leading indicators

Weekly or monthly signals that surface issues early. Attendance, engagement, milestone completion. They let you intervene before the lagging metric tells you the program failed.

Lagging indicators

Quarterly or yearly outcomes. Conversion rates, retention, wage gain. These are what the program is for, but they’re late.

Threshold alerts

The system flags when an indicator slips past its threshold. The team gets alerted in time to act, not informed at year-end.

Holds up to scrutiny

Every indicator has a written definition, source, cadence, and owner. External auditors and skeptical stakeholders can verify each one.

How it works

Five steps from program design to live measurement.

Define success and failure conditions

Before program design begins, write what counts as success and what counts as failure. Specific, quantitative, time-bound.

Identify the lagging indicators

What outcomes prove the program worked? Conversion rates, retention, wage gain, behavior change. These are the answers, but they’re slow.

Identify the leading indicators

What weekly or monthly signals predict the lagging outcomes? Attendance, engagement, milestone completion. These let you act early.

Set thresholds and ownership

For each indicator: at what level is it healthy, watching, or failing? Who owns it? What’s the escalation path when it slips?

Review on cadence; adjust the program

The framework is useless if no one looks at it. Weekly leading-indicator reviews; quarterly lagging reviews. Programs change based on what indicators say.

Real scenario

How an apprentice program caught a problem at week 8 instead of month 14.

Drawn from the Career Pathways measurement work at PlayStation. The leading indicator caught a problem fourteen months earlier than the lagging one would have.

Week 1

Pre-defined

Success: 50% apprentice → FTE conversion. Failure: <30%. Leading indicator: weekly mentor engagement > 80%.

Week 8

Leading slips

Mentor engagement drops to 76%. The framework flags it. Mentor program design is reviewed.

Week 10

Intervene

Mentor cadence restructured: shorter, more frequent check-ins instead of monthly long sessions. Engagement recovers to 85%.

Month 14

Lagging confirms

Apprentice conversion comes in at 50%, on target. Without the leading-indicator catch at week 8, conversion likely would have been ~35%.

Outcome

Designed-in early warning

The program improved during the cohort because the indicator system surfaced the problem in time. Not after the cohort ended.

How it connects

Measurement validates the rest of the platform.

Strategy Mapper

Indicators are defined here

The map is where indicators are defined; the framework is where they’re tracked, alerted on, and acted on.

Pathways

Funnel stages are leading indicators

Each stage of a pathway is a leading indicator for the placement/conversion outcome. Live drop-off visibility.

Scorecard

Tier health is an indicator

A partner’s score moving below threshold becomes a leading indicator. Early conversation, not year-end surprise.

ESG OS

Lagging feeds disclosure

Lagging indicators are most of what shows up in disclosures, but only if they’ve been defined and tracked properly.

Run the rest of the platform.

Measurement gives the rest of the platform its credibility. The tools work alone, but together they’re a defensible operating system for impact work.

Tool 06 · Engagement Architecture

Turn employee engagement into a structured operating system.

Most employee engagement programs run as a calendar of activities, volunteer days, giving drives, ERG events. Engagement Architecture treats employee participation as an operating system: every program tied to a strategic outcome, every hour of participation feeding into a pathway or partner relationship.

Built from Twilio engagement work, PlayStation operating models Delivers 68% participation, 24K service hours tied to outcomes
Engagement programs · tied to strategy
Skills volunteering
42%
Mentor program
28%
Pro-bono pathways
14%
Annual giving
62%
ERG impact circles
35%
Each program tied to a strategic outcome. No orphan activities.
Why this exists

Engagement programs disconnected from strategy are activity, not impact.

A volunteer day is a nice photo but doesn’t move the strategy unless the work feeds an outcome the company is trying to influence. Engagement Architecture connects every program to the strategy map, then matches participation depth to the depth the strategy needs.

Strategy linkage

Every engagement program connects to a named outcome on the strategy map. Programs that don’t connect get redesigned or sunset.

Skills-based volunteering

Match employee skills to nonprofit needs. Engineers don’t just paint walls, they build infrastructure that sticks.

Mentor pipelines

Mentor programs map to specific stages of pathways. A mentor isn’t a generic helper, they’re paired with apprentices in a structured cohort.

ERG impact circles

Employee resource groups become impact circles aligned to program priorities, not just affinity gatherings.

Pro-bono pathways

Senior IC and leader engagement through pro-bono work that materially advances a partner’s capability.

Defensible participation

Participation rates are reported alongside the outcomes they ladder to, not as a vanity metric on its own.

How it works

Five steps from event calendar to operating system.

Inventory current programs

List every engagement program currently active, with sponsor, budget, audience, and stated purpose. Most companies discover surprising overlap.

Map each program to the strategy

Use the Strategy Mapper. Programs that connect cleanly stay; programs that don’t connect get redesigned or sunset.

Match program depth to outcome depth

An anchor outcome needs a deep program (mentor pathway, pro-bono engagement). A community outcome can be served by lighter participation.

Wire participation into pathways

Mentor hours go into the apprentice pathway. Pro-bono goes into a partner’s capability building. Skills volunteering matches a defined need.

Report participation alongside outcomes

Never report participation in isolation. Always tied to the outcome it’s feeding. Hours alone are not a metric.

Real scenario

How Twilio engagement grew from event-based to outcome-based.

Drawn from the Twilio global employee engagement work (2016-2017), restructuring participation around strategic outcomes.

Audit

Event calendar

22 engagement programs running as a calendar of one-off events. Participation reported as hours; no link to strategy.

Map

Strategy linkage

Each program mapped against the strategy. 6 connected directly. 10 needed redesign. 6 didn’t connect and were retired.

Wire

Participation → pathway

Mentor hours wired into apprentice pathways. Skills volunteering matched to nonprofit capability gaps.

Report

Outcomes, not hours

Participation rates now reported alongside the apprentice cohort outcomes they’re feeding. The connection is visible.

Outcome

68% participation, tied to strategy

Participation rate climbed because the work now mattered to people. Engagement is no longer a calendar, it’s a strategy.

How it connects

Engagement only works connected to the rest of the platform.

Strategy Mapper

Programs ladder to outcomes

Every engagement program ties to one of the named outcomes. No orphan activity.

Pathways

Mentors plug into stages

Mentor programs map to specific stages of the apprentice pathway. Hours feed conversion.

Scorecard

Pro-bono builds partners

Pro-bono engagements materially raise a Program-tier partner’s execution score, capability building, not just hours.

Measurement

Participation has indicators

Participation rate is paired with the outcome metric. Always reported together.

Run the rest of the platform.

Engagement Architecture is the people side of the platform. It works alone, but it’s far more powerful when wired into Strategy, Pathways, and Measurement.

JD Match

Match a JD to my work.

Paste a job description or link. The tool returns a strength rating and case studies that map to it in 30 to 45 seconds.

Paste a job description or job link

Match engine
Pasted JDs and fetched links go to the matching engine for relevance scoring, not stored or logged. Typical run: 25–45 seconds.

Contact

Let's talk.

I'd love to hear from you. The form below reaches me directly, and I read every message myself. I'm open to senior roles in social impact, ESG, and community investment, and happy to chat about anything related.

Recruiting for a senior role

Agency or in-house. Bonus points if you paste a JD link, I can run it through my JD Match tool before we talk.

Hiring for your team

Corporate social impact, ESG, community investment, partnerships, workforce development.

Consulting opportunity

Project-based engagements covering strategy, operating model design, or building out a specific function.

Anything else

Peers in the field, alum from a shared company, or just curious. Always happy to connect.

Fifteen years across

Salesforce Twilio Sephora Box Sony PlayStation Splunk Proofpoint

Prefer another channel? Grab time on my calendar or reach me on LinkedIn.

If you have a JD link, I can run it through my JD Match tool before we talk.


Got it.

I read every one of these myself. You'll hear back within a couple of days.